The Management and Monitoring Strategic Plan for Conserved Lands in Western San Diego County: A Strategic Habitat Conservation Roadmap (or simply "MSP Roadmap" or "MSP") is a comprehensive, landscape-scale adaptive management and monitoring framework for prioritized species and vegetation communities in western San Diego County. By establishing biological goals and measurable objectives across the region, the MSP Roadmap provides for a coordinated effort among multiple key organizations in western San Diego County in the implementation of adaptive management and monitoring actions using the same approach. The MSP Roadmap categorizes and prioritizes plant and animal species, vegetation communities, and threats/stressors, identifies geographic locations for management and monitoring actions, provides specific timelines for implementation, and establishes a process for coordination and implementation. The MSP Roadmap includes databases and mapping tools ("MSP Portal") that are available on the San Diego Management and Monitoring Program’s (SDMMP) interactive website: https://sdmmp.com. The MSP Roadmap is divided into three volumes:
The MSP Roadmap is intended to be a living document with revisions to the databases and maps occurring as new information becomes available or as situations change (e.g., wildfire). Static text in the 3-volume document may be revised every 4 to 5 years. The current MSP Roadmap covers the 2017–2021 calendar year1 planning cycle. The MSP Portal should be used to access the most up-to-date information on goals, objectives, and actions contained in Vol. 2 and to query, map, and track the progress of implementation.
1 Calendar year (January 1–December 31) used because fiscal years differ between local, state, and federal partners and because it best represents the biological year for planning species and vegetation community management and monitoring.
The purpose of the MSP Roadmap is to provide a biologically based foundation to support decision making and funding priorities for managing species and vegetation communities on Conserved Lands (see Definitions, Vol. 1, Sec. 7) across western San Diego County. A large portion of open space lands in western San Diego County are within an approved or proposed large-scale Natural Communities Conservation Planning (NCCP) program plan.2 The conservation plans (both completed and in preparation) anticipate that biological management and monitoring will transcend plan boundaries (i.e., the plans are subregional plans and in aggregate compose a large portion of a regional plan). Each of these conservation efforts focuses on assembling, managing, and monitoring an interconnected preserve system for the persistence of rare and sensitive wildlife species and vegetation communities. Although a large amount of preserve lands has been assembled to date, management and monitoring of the preserve lands is largely the responsibility of each individual plan participant using existing budgets and staffing. This has resulted in high variability in the timing and methods used for data collection and difficulties in determining the status of covered species across the region, which is needed to inform sound management decisions.
With the passage of the TransNet Ordinance, funding now exists through the Environmental Mitigation Program (EMP)3 to support conservation planning efforts by providing a coordinated approach to managing and monitoring rare and sensitive wildlife species and vegetation communities across the region and across plan boundaries. In 2012, the San Diego Association of Governments (SANDAG) Independent Taxpayer Oversight Committee (ITOC) included the EMP in its triennial efficiency audit. The audit recommended that SANDAG staff:
The SDMMP was tasked with preparing the MSP Roadmap for SANDAG to fulfill the need for a strategic approach to implement management and monitoring objectives in a cost-effective manner. While the primary purpose of the MSP Roadmap is to assist with directing and evaluating the efficiency of TransNet EMP funding, this can only be done in the larger context of evaluating and prioritizing the existing threats, opportunities, and challenges at the regional and local levels. Nothing in the MSP Roadmap is intended to replace the existing obligations or requirements of local preserve managers and/or jurisdictions enrolled in the NCCP program. Instead the MSP Roadmap is intended to provide a framework for the efficient use of funds, to leverage existing funding, and to assist with regional open space planning efforts.
It should be noted that the MSP Roadmap was not developed to assign responsibilities for specific management and monitoring objectives but rather to identify "what" and "where" management is needed. The "where" in many instances is often preserve specific and, thus, may be interpreted to imply that a specific entity has responsibility for achieving specific objectives. This is not the intent of the MSP Roadmap when it identifies the specific "where" for some objectives. Implementation and funding for MSP Roadmap objectives may be accomplished using multiple resources and entities available as long as the land owner(s) and entities are in agreement (see Vol. 1, Sec. 5.0 for more information on the implementation process).
2 These are the San Diego Multiple Species Conservation Program (MSCP), San Diego Multiple Habitats Conservation Program (MHCP), and proposed San Diego North County Plan (NCP).
3 Go to www.keepsandiegomoving.org for more information on the TransNet EMP.
4 Sjobergevashenk Consulting Inc. 2012. TransNet Independent Taxpayers Oversight Committee: Fiscal Year 2012 Triennial Performance Audit. Chapter 4, Pages 66-71. Sacramento. March 8, 2012.
There are 3 other regional strategic plans already completed for western San Diego County. These strategic plans provide goals and objectives for connectivity monitoring (SDMMP 2011)5; invasive plant management (CBI et al. 2012); and species, vegetation communities, and threats/stressors management (SDMMP 2013), and are well underway with implementation and nearing the need for updating. The MSP Roadmap includes the elements of the 3 other strategic plans, provides updated goals and objectives, adds the element of adaptive monitoring, and expands the number of vegetation communities and threats/stressors previously included in the 2013 Management Strategic Plan. Because the MSP Roadmap takes much of the format and content from the 2013 Management Strategic Plan and updates and expands it, the acronym "MSP" has been maintained but now refers to both management and monitoring. When referring to the updated plan, the term "MSP Roadmap" will be used to indicate the current comprehensive Management and Monitoring Strategic Plan that includes the expanded and updated elements.
The MSP Roadmap incorporates the fundamental principles of the U.S Fish and Wildlife Service’s (USFWS) Strategic Habitat Conservation (SHC) Framework (USFWS 2008), which is defined as
5 The intent of the EMP is to provide support to San Diego NCCPs in the implementation of regional monitoring and management; thus, the covered species lists from each of the plans were included in the MSP Roadmap. Since the NCP is not finalized yet, the covered species list from the 2010 draft version was used but is expected to change. The MSP Roadmap is a living document and therefore adjustments to species included may occur in the future as needed and as determined appropriate through discussions with stakeholders.
The MSP Roadmap does not replace the need for preserve resource management plans, daily maintenance activities at existing preserves, or prior obligations negotiated with the USFWS and California Department of Fish and Wildlife (CDFW; collectively "wildlife agencies"). The MSP Roadmap establishes priorities and goals and objectives, which are advisory and meant to be consistent with the intent of regional plans. However, there may be preserve-level management concerns and NCCP obligations that are not addressed in the MSP Roadmap but are still important to fulfill. The MSP Roadmap should be used to inform the development and implementation of preserve resource management plans, annual work plans, and/or area specific management directives (ASMDs). The entities preparing resource management plans should use the MSP Roadmap to help determine whether any significant occurrences of species and/or Important Management Areas (IMAs; see Vol. 1, Sec. 2.0) are known to occur on their preserves; review the goals and objectives for species, vegetation communities, and threats/stressors; collaborate on the implementation of regional and local objectives; and use the outcome of regional efforts to inform and augment their management activities.
There is concurrence by the stakeholders that management and monitoring needs to be implemented efficiently and strategically, and coordinated between the various land owners. In that vein, the stakeholders acknowledged a need to develop guidance on the preparation and implementation of preserve resource management plans for individual preserves as well as regional goals and objectives (i.e., MSP Roadmap). The MSP Roadmap along with the regional conservation plans (i.e., MSCP, MHCP, and proposed NCP) together should provide the foundation for preserve managers to develop site-specific resource management plans. The MSP Roadmap will be implemented in many instances through preserve resource management plans utilizing ASMDs.
The geographic area covered by the MSP Roadmap encompasses the plan areas for the MSCP, MHCP, proposed NCP, and lands immediately to the east of these plan areas up to the watershed divide (Figure V1.1-1). The remaining desert land toe east may be included in the future if an East County NCCP is developed. The MSP Roadmap Area (MSPA) was originally divided into 8 management units (MUs) in the 2013 MSP, but has been further expanded to include 3 additional MUs for a total of 11 MUs. The MSPA and MUs are further characterized in Vol. 1, Sec. 3.0. While over 620,000 acres of land are conserved through various mechanisms in the MSPA, the assembly of the preserve system is only partially completed. The MSP Roadmap only addresses Conserved Lands within the MSPA. As additional lands are conserved they will be incorporated into updates of the MSP Roadmap.
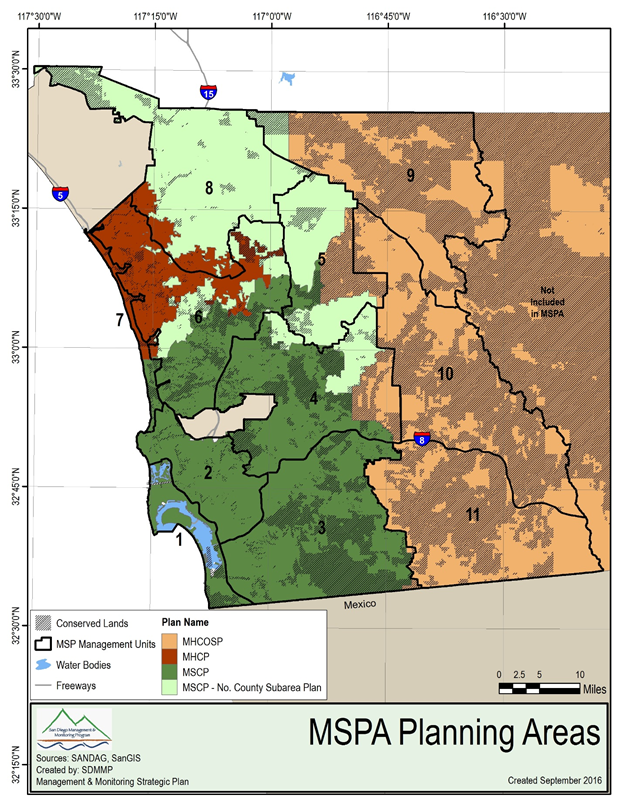
Figure V1.1-1. Geographic Area Covered by the MSP Roadmap ("MSP Area" or "MSPA")
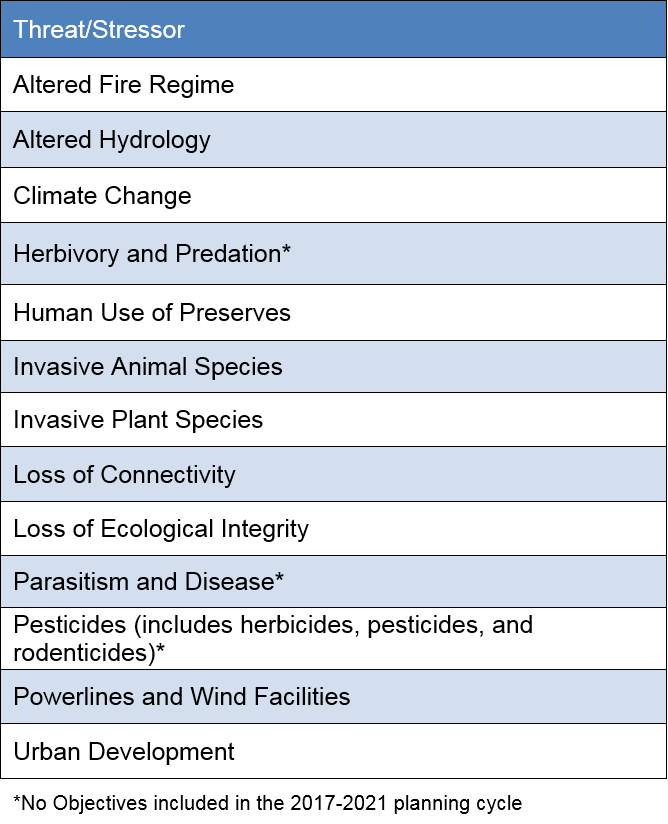
A total of 111 plant and animal species (Table V1.1-1), 11 vegetation communities (Table V1.1-2), and 13 regional threats/stressors (Table V1.1-3) are included in the MSP Roadmap. The 111 plant and animal species (collectively referred to as "MSP Species") comprise 109 covered species from the MSCP, MHCP, and proposed NCP (draft 2010), plus 2 additional species of concern (Fremontodendron mexicanum and Monardella stoneana). Nine additional species were initially evaluated but excluded from the MSP Roadmap because the data available indicated they no longer occur in the MSPA, data were insufficient to develop management goals and objectives, or taxonomic revisions lumped a species with more common taxa so that the species is no longer considered a conservation priority. MSP species were categorized by risk level and management needs (see Vol. 1, Sec. 2.0 for more information). Not all species, vegetation communities, or threats/stressors have been given priority in the next 5-year calendar year planning cycle (2017–2021; see Vol. 1, Sec. 2.0 for rationale).
Table V1.1-1. Species Included in the MSP Roadmap ("MSP Species").
Table V1.1-2. Vegetation Communities included in the MSP Roadmap.
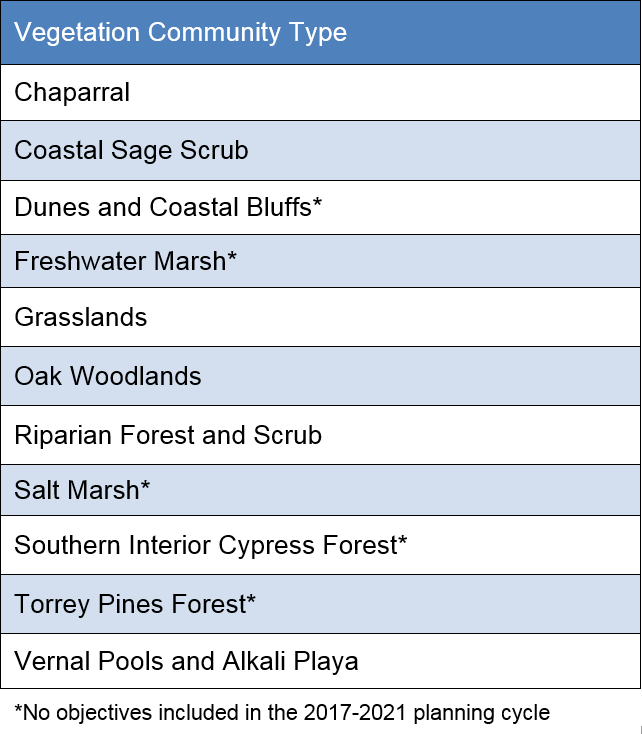
Table V1.1-3. Threats/Stressors included in the MSP Roadmap.
Baker, R. J., L. C. Bradley, R. D. Bradley, J. W. Dragoo, M. D. Engstrom, R. S. Hoffman, C. A. Jones, F. Reid, D. W. Rice, and C. Jones. 2003. Checklist of North American Mammals North of Mexico, 2003. Occasional Paper, Museum of Texas Tech University, Number 229.
Baldwin, B. G., D. H. Goldman, D. J. Keil, R. Patterson, and T. J. Rosanti (eds). 2012. The Jepson Manual: Vascular Plants of California. Second Edition, Thoroughly Revised and Expanded. University of California Press, Berkeley, CA.
Banks, R. C., C. Cicero, J. L. Dunn, A. W. Kratter, P. C. Rasmussen, J. V. Remsen, Jr., J. D. Rising, and D. R. Stotz. 2006. Forty-Seventh Supplement to the American Ornithologist’s Union Check-List of North American Birds. Auk 123:926–936.
CBI, DENDRA, Inc, and Cal-IPC. 2012. Management Priorities for Invasive Non-native Plants: A Strategy for Regional Implementation, San Diego County, California. Prepared by the Conservation Biology Institute, Dendra Inc. and California Invasive Plant Council for the San Diego Association of Governments. Contract No. 5001322. September 2012.
Chesser, R.T., R.C. Banks, F.K. Barker, C. Cicero, J.L. Dunn, A.W. Kratter, I.J. Lovetter, P.C. Rasmussen, J.V. Remsen, Jr., J.D. Rising, D.F. Stotz, and K. Winker. 2011. Fifty-Second Supplement to the American Ornithologist’s Union Check-List of North American Birds. Auk 128:600–613.
Crother, B. I. 2008. Scientific and Standard English Names of Amphibians and Reptiles of North America North of Mexico with Comments Regarding Confidence in Our Understanding. Sixth Edition. Committee on Standard English and Scientific Names, Official Names List of the American Society of Ichthyologists and Herpetologists, the Herpetologist’s League, and the Society for the Study of Amphibians and Reptiles.
Integrated Taxonomic System (ITIS). 2013. Authoritative Taxonomic Information on Plants, Animals, Fungi and Microbes of North America and the World. www.itis.gov.
City of San Diego. 1998. Final Multiple Species Conservation Program: MSCP Plan.
County of San Diego. 2010. Draft North County Multiple Species Conservation Plan Conservation Analysis.
County of San Diego. 1997. Multiple Species Conservation Program: County of San Diego Subarea Plan.
AMEC, Conservation Biology Institute, Onaka Planning & Economics and the Rick Alexander Company. 2003. Volume I: Final MHCP Plan. Prepared for Multiple Habitat Conservation Program.
SDMMP(San Diego Management and Monitoring Program). 2011. Connectivity Monitoring Strategic Plan for the San Diego Preserve System. Prepared for the San Diego Environmental Mitigation Program Working Group.
SDMMP. 2013. Management Strategic Plan for Conserved Lands in Western San Diego County, 3 Volumes. Prepared for the San Diego Association of Governments. San Diego. Version 08.27.2013.
Sjobergevashenk Consulting Inc. 2012. TransNet Independent Taxpayers Oversight Committee: Fiscal Year 2012 Triennial Performance Audit. Chapter 4, Pages 66-71. Sacramento. March 8, 2012.
USFWS (U.S. Fish and Wildlife Service). 2008. Strategic Habitat Conservation Handbook: A Guide to Implementing the Technical Elements of Strategic Habitat Conservation (Version 1.0). Report from the National Technical Assistance Team, February 11, 2008.
Southern California is part of the California Floristic Province, a mediterranean climate region in the United States that extends along the Pacific Coast from southern Oregon south to San Diego County, to the border with Mexico, and then into northern Baja California, Mexico. This region is characterized by cool, wet winters and hot, dry summers. For decades, loss of habitat due to urban development has been the greatest threat to the rich biodiversity and natural ecosystems in southern California (Underwood et al. 2009). The California Floristic Province is ranked among the top 25 global biodiversity hotspots (Myers et al. 2000) and along with other mediterranean climate regions supports many endemic species, particularly plants (Underwood et al. 2009). This region began rapidly developing after World War II and now has the greatest urban area and highest human population density of any of the world’s mediterranean regions (Underwood et al. 2009). Coastal sage scrub is a vegetation community within the California Floristic Province that supports high biodiversity and rare species, and in 1980 was estimated to occupy only 15% of its former extent due to urbanization (Westman 1981).
In mediterranean systems, high human population densities and extensive urbanization are associated with threatened species richness (Underwood et al. 2009). San Diego County is especially biodiverse and has one of the greatest concentrations of endangered species richness in the United States (Dobson et al. 1997). Regional landscape scale conservation planning was initiated in the 1990s to address the threat that increasing urbanization posed to rare, endangered and threatened species; to biodiversity; and to natural ecosystems in San Diego County (Atkinson et al. 2004). Conservation plans protecting multiple species and their habitats currently encompass hundreds of thousands of acres (e.g., County of San Diego 1997; City of San Diego1998; SANDAG 2003).
Meeting the conservation goals of San Diego’s multiple species and habitat conservation planning efforts is challenged by rapidly changing and intensifying disturbance regimes that threaten the persistence of conserved species and vegetation communities. New threats arising from human activities, such as climate change, are emerging to further impact conserved natural resources.The greatest uncertainties lie in figuring out how multiple and potentially interacting threats are affecting species, vegetation communities, ecosystem functions, and natural disturbance processes. As an example, since the inception of multiple species and habitat conservation plans in San Diego County, large-scale and increasingly frequent wildfires, partially related to drought and projected to increase with climate change, have facilitated the invasion of nonnative plants and degraded vegetation communities on Conserved Lands in San Diego County (see Vol. 2B, Sec. 1.0). In many cases, these threats are also acting as drivers of environmental change at a global scale.
Worldwide, natural ecosystems are threatened by changing land use, increased nitrogen deposition and carbon dioxide enrichment of soils, the introduction of alien species, overharvesting and consumption of natural resources, and a changing climate (Sala et al. 2000; Millennium Ecosystem Assessment 2005; Mcdonald et al. 2008; Tylianakis et al. 2008). These drivers of environmental change can interact, often in unknown ways and at multiple scales, to affect ecosystem processes and natural disturbance regimes (Perring et al. 2016), and to cause declines in biodiversity and species extinctions (Millenium Ecosystem Assessment 2005; Brook et al. 2008; Butchart et al. 2010). Interactions between multiple global change drivers and natural ecosystems are unpredictable, varying in both magnitude and direction of effects, and are complicated by indirect or higher order effects, making it problematic to predict how ecosystems will respond to future environmental changes (Tylianakis et al. 2008; Doblas-Miranda et al. 2015; Côté et al. 2016). There can also be land-use legacy effects, where conditions have been altered by past land use practices and are affecting current species and ecosystem processes and are also influencing the direction and magnitude of change caused by present-day drivers of environmental change (Perring et al. 2016).
Mediterranean climate ecosystems, such as those in San Diego County, are predicted to have the largest change in biodiversity because of their vulnerability to all of the drivers of global change (Sala et al. 2000). These systems are especially vulnerable to changing land use, increasing aridity from a changing climate, changes in natural fire regimes, biological invasions, and increasing levels of nitrogen deposition (Sala et al. 2000; Doblas-Miranda et al. 2015).
To successfully meet the conservation goals of San Diego’s NCCP efforts under increasing threats and changing environmental conditions requires closely integrating monitoring and management programs (Atkinson et al. 2004). Managing to reduce threats is essential to the persistence of conserved species and to maintaining natural vegetation communities and ecosystem processes. Monitoring is critical to understanding the status of conserved resources and how they are affected by threats and whether management to alleviate threat levels is successful.
It is challenging to carry out large-scale management and monitoring programs, given the financial and human resources required to monitor and manage a multitude of species and vegetation communities conserved across thousands of acres of land. To further complicate matters, there are gaps in our knowledge for many protected species regarding their current distribution and status, population dynamics, habitat requirements, life history attributes, and responses to threats and management actions. There are also critical uncertainties in our understanding of the composition, structure, and functioning of natural vegetation communities and ecoystems, including how these systems respond to disturbances such as fires, floods, and droughts, which may be becoming more frequent and intensive (Atkinson et al. 2004). Scale is also an important consideration to effectively monitor and manage species and ecosystems (Seidl et al. 2016; Wurtzebach and Schultz 2016). There is a need for detailed site-specific monitoring information that is important for local-scale management as well as a need for landscape-scale monitoring to understand large-scale processes and interactions and to establish regional management priorities.
Managing and monitoring natural resources where there is a great deal of uncertainty and lack of knowledge requires an adaptive management framework (Atkinson et al. 2004; Lindenmayer and Likens 2009; Côté et al. 2016). The aim of this science-based, iterative approach is to identify and monitor critical uncertainties about species ecology, vegetation communities, and natural ecosystem functions and measure responses to threats and management actions, and then use this information to adjust management strategies to reduce uncertainty and improve effectiveness over time (Atkinson et al. 2004). In adaptive management, alternative management actions are tested and management strategies are adjusted if new actions are shown to improve efficiency or success at achieving management objectives.
For adaptive management to be successful, it is important to develop carefully considered questions that are relevant to understanding and managing the natural resource of interest (Lindemayer and Likens 2009). These questions should be based upon what is known about the species’ life history or ecology, and vegetation community or ecosystem characteristics and processes. Furthermore, it is critical to understand how species and systems respond to disturbance and threats and to management to reduce these threats. A number of conceptual models are available that formally summarize the ecology of species or vegetation communities, the effects of natural and anthropogenic drivers on key community or life history attributes, and management responses (Atkinson et al. 2004; Hierl et al. 2007; Lindemayer and Likens 2009). Summarizing this knowledge is important in identifying what to manage, preparing management strategies to achieve conservation goals, and determining how to monitor the effectiveness of management actions and strategies.
For adaptive management to be successfully implemented, it is important to test effectiveness of management actions. This requires designing experiments to test different management techniques and also evaluating the effectiveness of management once a method is selected. Evaluating the effectiveness of management actions requires a statistically rigorous sampling design with sufficient analytical power to distinguish between competing management methods. An adaptive management approach also incorporates decision making that is dependent on thresholds for initiating management, assessing management effectiveness, and determining whether management goals are being met (Niemi and McDonald 2004; Lindenmayer et al. 2013; Cook et al. 2016; Wurtzebach and Schultz 2016).
Atkinson et al. (2004) identified 2 types of monitoring important in adaptive management of multiple species conservation plans:
The adaptive monitoring component includes changing the monitoring program as needed to carry out adaptive management and requires explicitly defining what is being changed in the monitoring program (Lindemayer et al. 2011). Examples of adaptive monitoring include using new protocols as technology improves data collection techniques or increasing the frequency of monitoring when species are declining and new information about factors contributing to the decline could be useful for management (Lindemayer et al. 2013). The monitoring program may also be altered to address questions about species or vegetation community recovery following a wildfire or other disturbance. To make changes to an existing monitoring program, it is necessary to determine whether it is statistically valid to do so and to maintain the long-term integrity of the monitoring program (Lindemayer et al. 2011).
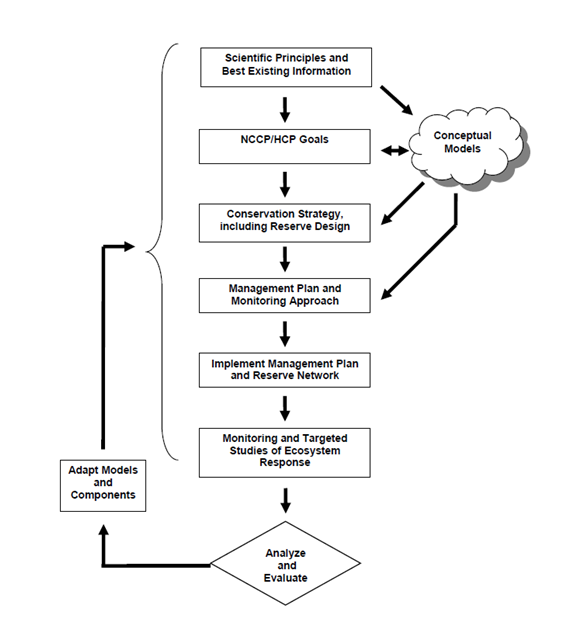
An adaptive management feedback loop integrates monitoring and management actions into an iterative approach to achieve conservation goals (Figure V1.2-1). The first step in this feedback loop described by Atkinson et al. (2004) entails compiling the best available science and information on conservation targets to prepare conservation goals and to create conceptual models to guide the conservation strategy. After establishing the conservation strategy, a reserve system is designed to meet conservation goals. The next step is to develop the management program and to design the monitoring program to test the assumptions upon which the conservation strategy and management programs are based. After this, the reserve system is instituted and management and monitoring actions are implemented. Monitoring data are then analzed and the results incoporated into the next iteration of the feedback loop. Based on new information and a reduction in critical uncertainties, management and monitoring plans may be adjusted and, in some cases, the conservation strategy is modified.
Figure V1.2-1. NCCP/HCP Adaptive management feedback loop from Atkinson et al. 2004.
The MSP Roadmap provides a coordinated framework for regional management and monitoring of Conserved Lands by prioritizing and specifying goals and objectives for species, vegetation communities, and threats/stressors for the entire region over a 5-year planning cycle. MSP Roadmap objectives are based on an adaptive approach and incorporate what has been learned from previous monitoring and management to improve efficiency and effectiveness. Table V1.2-1 provides several examples of this approach in the MSP Roadmap. For example, the results of 2011–2013 genetic studies of coastal cactus wrens and coastal California gnatcatchers in southern California point to different management strategies for these 2 species, even though they often co-occur and have some similar ecological and life history attributes. Cactus wrens that rely on cactus scrub, a subset of coastal sage scrub occupied by the gnatcatchers, were shown to have isolated populations, low genetic diversity and poor dispersal abilities in fragmented landscapes. In contrast, gnatcatchers dispersed freely through the same landscape matrix of urban development and fragmented Conserved Lands and exhibited high gene flow and genetic diversity.
These differences are important in prioritizing management. For cactus wrens, the strategy is to quickly restore cactus scrub habitat to expand cactus wren populations and increase connectivity to reduce local extinction of isolated populations and to enhance genetic diversity. In contrast, for gnatcatchers, there is no need to expend scarce resources to improve connectivity; rather, the emphasis should be on maintaining existing linkages. Without information obtained from the genetics study, the MSP Roadmap gnatcatcher management strategy may have included restoring and creating gnatcatcher linkages, which would uneccessarily divert resources from more pressing management needs.
A number of steps needed to be completed to develop the MSP Roadmap’s adaptive management and monitoring framework. The following 7 steps were taken to prepare the MSP Roadmap and are described in greater detail below.
The MSP Roadmap incorporates an adaptive management and monitoring approach as generally described in the previous section, with a focus on managing for ecological integrity and resilience. Parrish et al. 2003 adapted Karr and Dudley’s 1981 definition of ecological integrity as follows:
An ecological system with high integrity is one where different aspects of the system, such as composition, structure, and function, are within the natural range of variation and when impacted by natural or human-caused disturbance can recover to its previous state (Parrish et al. 2003; Wurtzebach and Schultz 2016). Resilience is a measure of this capacity of a system to respond to disturbance and recover to its former state. Systems that maintain their native species and natural processes are thought to be more resilient to natural disturbances and anthropogenic threats over time (Parrish et al. 2003).
Measuring the ecological integrity of a specific system at a specific location requires comparing aspects of the ecosystem with pristine and undisturbed reference sites or by comparing it with measures in the historic range of variation for that system (Wurtzebach and Schultz 2016). These comparisons give an indication of how degraded the system is at a particular site and define its ecological integrity. In many cases, the historic range of variation is unknown and the comparison is among contemporary systems, carefully picked to best reflect what are hypothesized to be natural, high integrity systems.
The terms "threats" and "stressors" are used interchangeably in this document to represent those factors or processes that may impact MSP species and necessitate the need for management to ensure species persistence. Many threats/stressors are drivers of environmental change associated with human-induced changes to the environment and ecological processes or are a result of direct human disturbance. Threats can also be natural disturbances that are changing as a result of human activities, such as fire regimes, drought, and flooding.
The primary management focus for the MSP Roadmap’s 2017–2021 calendar year planning cycle is to reduce threats to maintain or enhance high levels of ecological integrity and resilience at prioritized and interconnected species occurrences, vegetation communities, and ecosystems. For example, to effectively manage coastal sage scrub vegetation at sites important to the coastal California gnatcatcher, a priority MSP species, the strategy might be6 to reduce the dense cover and spread of invasive nonnative grasses and forbs. By reducing these competitors for water and light, native plant populations can be enhanced with greater resilience to drought and capacity to support gnatcatcher arthropod food resources. Controlling nonnative plants could also lower the risk of post-fire habitat degradation by decreasing alien seed banks and limiting their spread and establishment, thus allowing for natural recovery of native plants following a fire. Managing for high ecological integrity and then monitoring species and system responses at managed and unmanaged sites can lead to a greater understanding of the species or system’s capacity to persist under changing environmental conditions and with appropriate management.
The MSP Roadmap management approach also focuses on maintaining or establishing multiple interconnected species occurrences to enable population rescue and gene flow with occurrences being sufficiently spread out spatially to avoid the loss of all occurrences from a single threat or disturbance, such as a catastrophic wildfire. Ensuring there are multiple interconnected occurrences with high ecological integrity reduces the vulnerability of a species to local extinction or extirpation from the MSPA.
6 This example is for illustrative purposes only. The California gnatcatcher strategy is still being developed based on data analysis from a regionwide study.
Under the MSP Roadmap management strategy, it is important to gather information to determine management needs (see Sec. 2.4.2, Adaptive Monitoring Approach, below). This includes an assessment of the distribution and status of the species or vegetation community, habitat relationships, and type and magnitude of threats across the MSPA. It includes collecting occurrence or site-specific information to determine the local management needs. It may be necessary to resolve critical uncertainties relevant to management of threats to species and vegetation communities. As an example, this can include gathering data on a species’ population dynamics in relation to drought or determining how a vegetation community responds to an altered fire regime. It is also essential to test management practices and determine BMPs that mitigate various threats under different environmental conditions. Many objectives during the 2017–2021 MSP Roadmap planning cycle involve filling knowledge gaps and obtaining information needed for effective management.
After collecting data critical to management, it is important to develop plans prioritizing management objectives and specifying actions to be implemented over time and monitored for effectiveness. Typically, these plans are management plans for a particular species or vegetation community, although other types of plans include seed collection, banking and bulking plans for rare plants, connectivity improvement plans for wildlife, and fire management plans for species most at risk. Management plans are based upon what is known about the species or vegetation community of interest and site-specific information about status, habitat, or environmental attributes and threats.
Species and vegetation communities are prioritized for management based on an evaluation of the current status of a species occurrence or vegetation community at a specific site (e.g., abundance, composition, structure, ecological integrity), type and magnitude of threats, ability to manage threats, importance of the site in terms of connectivity or for increasing the total number and dispersion of occurrences/sites in the MSPA, and other relevant management information. Typically, highest-priority management actions are concentrated on species occurrences critical for long-term persistence or on areas with vegetation communities that support important MSP species. High-priority management objectives and actions are developed in response to identified threat(s) with a reasonable assumption that management actions can reduce threats over time. Management plans include decision thresholds, success criteria, and recommendations for a 5-year time frame. Management plans also provide guidelines or plans for monitoring the effectiveness of management actions to determine how well actions are working to meet management goals. These guidelines or plans include specification of the monitoring questions, sampling design, and protocol. For longer-term or more regional management objectives, a more detailed monitoring plan may be necessary. Where feasible, management effectiveness monitoring can be integrated into longer-term regional monitoring (see Sec. 2.4.2, Adaptive Monitoring Approach, below).
The final steps in the management strategy are to implement high-priority management actions and to determine how well management is working to mitigate threats and maintain, enhance, or establish robust species occurrences or to maintain and enhance vegetation communities and natural ecosystems. Data collected on effectiveness of management actions is evaluated and management is adjusted as needed to be most effective. Management plans are reviewed and revised as needed in the next planning cycle.
In addition to managing for ecological integrity and resilience under current threats and environmental conditions, the MSP Roadmap management strategy includes preparing for increasing intensities and complicated interactions among global change drivers that may create novel environments in the future. This entails developing models predicting future conditions based on different climate, land use, fire regime, and other threat scenarios and then analyzing the potential responses of species, vegetation communities, and ecosystem processes. These responses may involve shifts in species distributions, demographics and population dynamics, changing composition and structure of vegetation communities, and altered ecosystem processes. By monitoring species and ecosystems under current conditions, information will accumulate on how species and ecosystems are responding to threats and the effectiveness of management actions. This information is currently unavailable for many species, vegetation communities, and ecosystem processes and it is important to address these knowledge gaps before undertaking more aggressive management that might be required under future conditions. By better understanding drivers of environmental change and species and ecosystem responses, predictions can be made as to whether species or systems are likely to persist in place under projected future conditions. If modeling indicates that species, vegetation communities, or ecosystems are unlikely to persist, then alternative management strategies can be developed in future planning cycles, such as assisting migration to areas predicted to be more suitable in the future.
MSP Roadmap monitoring is designed to provide information that is important to the effective management of species, vegetation communities, threats/stressors, and natural ecosystem processes on Conserved Lands in western San Diego County. The MSP Roadmap has 4 target monitoring groups: Species (Vol. 2D), Vegetation Communities (Vol. 2C), Threats/Stressors (Vol. 2B), and Abiotic Monitoring, which all feed into monitoring the Regional Preserve System (Vol. 2A) (Figure V1.2-2). By monitoring these target groups, information is gathered to assess the status of MSP species and vegetation communities over time; determine threats/stressors and management needs; evaluate the effectiveness of management actions; and to decide whether adjustments need to be made to the management actions or strategy to achieve greater success in reaching management goals. Targeted monitoring is used to address knowledge gaps or develop BMPs and provides information important in improving the effectiveness of management actions. Regional preserve system monitoring integrates and synthesizes monitoring data from the 4 target groups to provide an evaluation of how well the preserve system is functioning to meet MSP goals (see Vol. 2A).
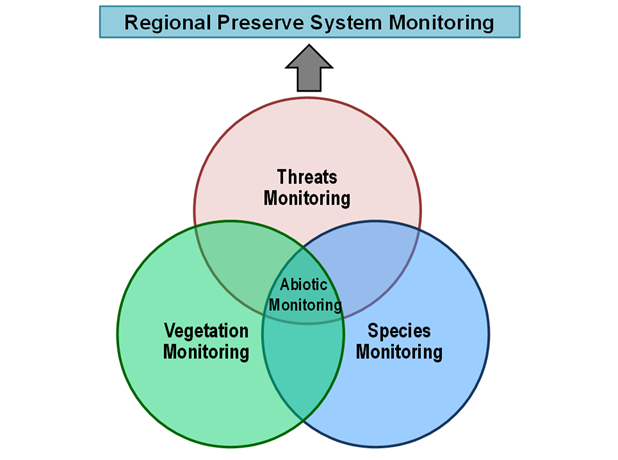
Figure V1.2-2. Venn diagram showing the overlap in monitoring targets where results are compiled and incorporated into an assessment of the state of the regional preserve system.
General monitoring questions are prepared for each target group (Figure V1.2-3) and are further refined when developing monitoring objectives for the regional preserve system, individual species, and specific vegetation communities and threats. MSP monitoring objectives either specify monitoring to address specific information needs or are aimed at developing and implementing a longer-term regional monitoring plan. Each monitoring objective is developed in response to at least one and often multiple monitoring questions. Monitoring questions include those addressing the monitoring objective and are of a more biological nature as well as questions that address statistical design, such as the power to detect a specified change in a monitoring parameter.
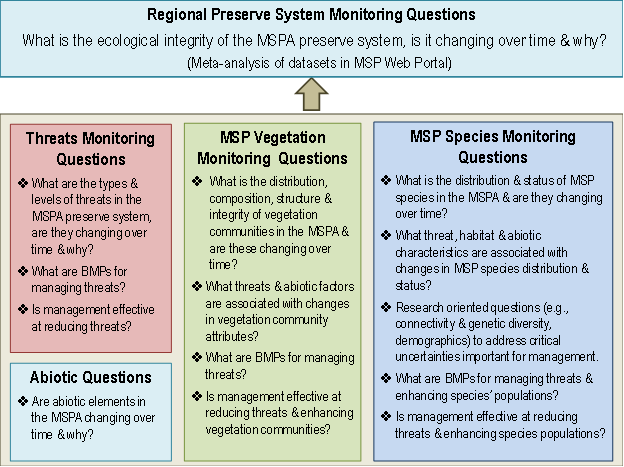
Figure V1.2-3. General questions addressed in the MSP Roadmap Adaptive Monitoring Plan for each group of monitoring target.
Targeted monitoring is used to address information needs that are often of a short-term nature and more localized in extent. This type of monitoring is usually associated with specific questions regarding critical management uncertainties followed by questions associated with the sampling strategy. Targeted monitoring includes objectives such as baseline surveys to determine the distribution and status of a species, post-fire surveys to document recovery of a species or vegetation community, or genetics studies to monitor species population connectivity and genetic diversity. Targeted monitoring also includes research studies to better understand the ecology, demography, and habitat requirements of a species or the integrity of ecosystem processes. Targeted monitoring objectives include monitoring the results of management actions when developing BMPs. Targeted monitoring requires specifying the questions to be addressed, a sampling design, and sampling protocols but does not require preparing a detailed monitoring plan.
Monitoring plans are developed to create long-term regional monitoring programs to track the distribution and status of a species or vegetation community over time and across the MSPA. This type of monitoring involves collecting data on threats/stressors, habitat attributes including abiotic elements, and ecological integrity. These data will be analyzed to better understand species population dynamics or changes in vegetation community attributes in relation to environmental conditions, such as habitat associations and the impact of threats/stressors. Monitoring plans detail specific goals, questions, objectives, actions, and analytical methods. A sampling design is prepared that specifies the power to detect a selected level of change in a monitoring parameter, such as occupancy or abundance, for the selected analytical method. The sampling design also identifies the overall sampling frame, and location and number of sampling points to meet analytical requirements and to fully characterize the system of interest. Monitoring plans also include the adoption or development of regional monitoring protocols and stipulate the frequency of monitoring activities. All species and vegetation monitoring protocols include collection of covariate data to characterize the abiotic environment, vegetation community, threats/stressors, and other specific information that apply to management of that particular species or vegetation community.
Species and vegetation community monitoring parameters are analyzed relative to covariates collected in the field and calculated from geographic information system (GIS) data layers to identify environmental factors associated with population dynamics. Data analyses will also indicate when species or vegetation communities are in decline or have a high degree of threat that needs to be managed. This information is fed into the adaptive management feedback loop to improve management strategies and effectiveness at reaching management goals. Results from long-term monitoring are used to develop specific management actions, such as identifying plants to include in restoration palettes, identifying restoration sites with appropriate habitat attributes, and prioritizing threat management to increase ecological integrity and resilience. Management plans also include a monitoring component to determine the effectiveness of implementing high-priority management actions for species or vegetation communities (see Sec. 2.4.1, above). Monitoring guidelines and, in the case of longer-term management, monitoring plans, are incorporated into the management plan to ensure appropriate sampling design to meet management objectives.
Monitoring plans are also developed to assess the magnitude and distribution of threats/stressors across the landscape to help inform where to implement threats management. These plans are similar to species and vegetation monitoring plans, except that the focus is on documenting the threat itself and obtaining information to manage it across the MSPA or at prioritized locations that will provide the greatest benefit, either in reducing the threat’s spread or mitigating impacts for specific MSP species or vegetation communities.
There are a variety of metrics to be monitored in the MSPA depending on the monitoring target and monitoring questions (Figure V1.2-4). For long-term regional species monitoring, the metrics tend to include measures of species population attributes such as presence/absence, percent area occupied, and abundance. For targeted studies, metrics often include characterizing aspects of a species reproduction or survival, dispersal, and genetic diversity. Covariates measure attributes of the environment and may be calculated using GIS data layers or collected during field surveys. Similarly, vegetation community monitoring typically involves collecting data describing plant composition, structure, and ecological integrity (e.g., percent cover, plant height, native and nonnative species richness), along with environmental attributes. Abiotic data collected in field typically include weather measurements at automated stations, soil attributes from sensors embedded in the ground, or by mapping soil properties. Topographical, climate, and soil variables are also calculated from GIS data layers and can be used in species distribution modeling to characterize species habitat requirements. Threat metrics vary; some may be mapped in GIS, such as modeled nitrogen deposition or mapped like fire perimeters, urban development, and artificial night lighting, often with the use of aerial photos and satellite remote imagery. Threats are also characterized in the field to provide site-specific information.
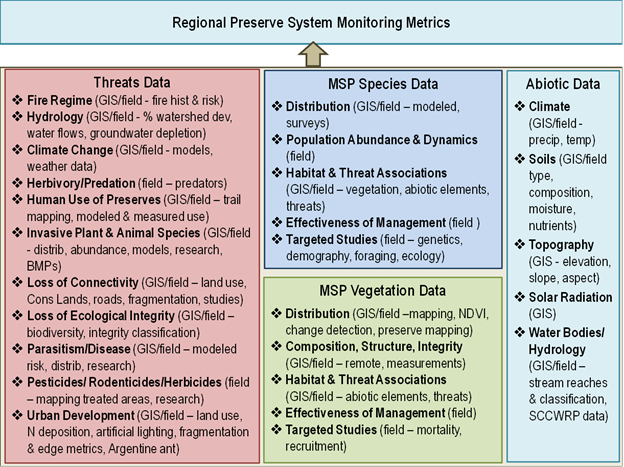
Figure V1.2-4. Examples of the types of monitoring metrics that will be collected for target monitoring groups.
Information will be gathered on soils, topography, hydrology, and climate across the MSPA to better understand how these abiotic factors influence species, vegetation communities, and ecosystems. More information on potential regional metrics to be included in monitoring is presented in the Regional Preserve System Monitoring section (Vol. 2A).
GIS-based data layers will be used to characterize and analyze abiotic conditions across the landscape. These layers will be included in species and vegetation habitat modeling to guide monitoring design, identify potential restoration sites for expanding populations and enhancing connectivity, and to better understand habitat relationships. Climate change modeling can be used to predict potential shifts in species and vegetation community distributions under future climate and urbanization scenarios to guide long-term management planning. Abiotic conditions across the landscape can be characterized to inform management for certain species by identifying climate refugia, abiotic microhabitats, areas with high climate variability versus more stable climate, and high topographic heterogeneity.
In addition to GIS-based data, abiotic data will also be collected from field sampling and from automated sensors that collect data at specific locations over time. This includes weather stations to collect precipitation, temperature, humidity, and wind data, and soil sensors to record temperatures, moisture, and other attributes. A network of these weather and soil sensor systems can be used to model species population dynamics, analyze demographic responses and provide a better understanding of habitat relationships. Co-locating these automated sensor systems with long-term species and vegetation monitoring plots is critical to understanding how species distributions; demographics and population dynamics; and vegetation composition, structure, and ecological integrity are responding to changing climate. Better understanding of the relationships of abiotic conditions to species, vegetation communities, and ecosystems will facilitate more effective and objective management decision making.
Regional preserve system monitoring entails compiling abiotic, species, vegetation, and threat monitoring data and conducting meta-analyses and syntheses to characterize the state of the preserve system. The central focus of this monitoring is to determine the ecological integrity of the preserve system, how it changes over time, and what factors are associated with this change. A detailed description of regional preserve system monitoring is provided in Vol. 2A.
Different types of monitoring data are compiled, analyzed, and synthesized to provide simple or more complex metrics to evaluate how well the preserve system is doing overall and in meeting species, vegetation, and threat/stressor management goals. To characterize the regional preserve system, a broad landscape-scale mapping of information is undertaken using GIS. This involves compiling all GIS-based data layers and predictive models and determining which variables are relevant to characterizing the integrity of the preserve system. Meta-analyses can be conducted across multiple datasets to identify common effects or landscape-scale patterns. GIS landscape-scale analyses can be condensed into simpler metrics and portrayed in a dashboard or scorecard format.
There are 2 levels for evaluating monitoring data. The first level includes simple metrics that are most relevant to the public and decision makers and provide easily understood descriptors of how the preserve system is doing overall, such as a score card with rankings of ecological integrity or key preserve system attributes. There may also be simple metrics characterizing the status of key threats, priority MSP species and vegetation communities, or important ecological processes across the MSPA. The second level of evaluating monitoring data includes analyzing more biologically detailed metrics to determine if management objectives are being met, to characterize the status and ecological integrity of the monitoring target, and to provide results that apply directly to management decisions.
Results of analyses from species, vegetation, and threat/stressor monitoring objectives can be synthesized to better understand how the system is working and responses to management.
The second step in developing the MSP was to identify the geographic area to be included and to divide the area into manageable units. Because the MSP is intended to support existing conservation planning efforts in San Diego County, the geographic area of the MSPA encompasses the planning areas for the MSCP, MHCP, and proposed NCP. Lands immediately east of these planning areas were also included in the 2013 version of the MSP as requested by the City of San Diego Public Utilities Department. In 2016, 3 new MUs were added to the 2013 version of the MSP, extending the MSPA to the eastern watershed boundaries in San Diego County, because many MSP species are dependent on upstream source populations or are impacted by threats that are carried downstream. Activities in these new MUs (9, 10, and 11) should focus on monitoring and management that will directly benefit MSP species occurrences in the original MUs (1 through 8). The MSP only addresses Conserved Lands within the MSPA. As additional lands are conserved they will be incorporated into updates of the MSP.
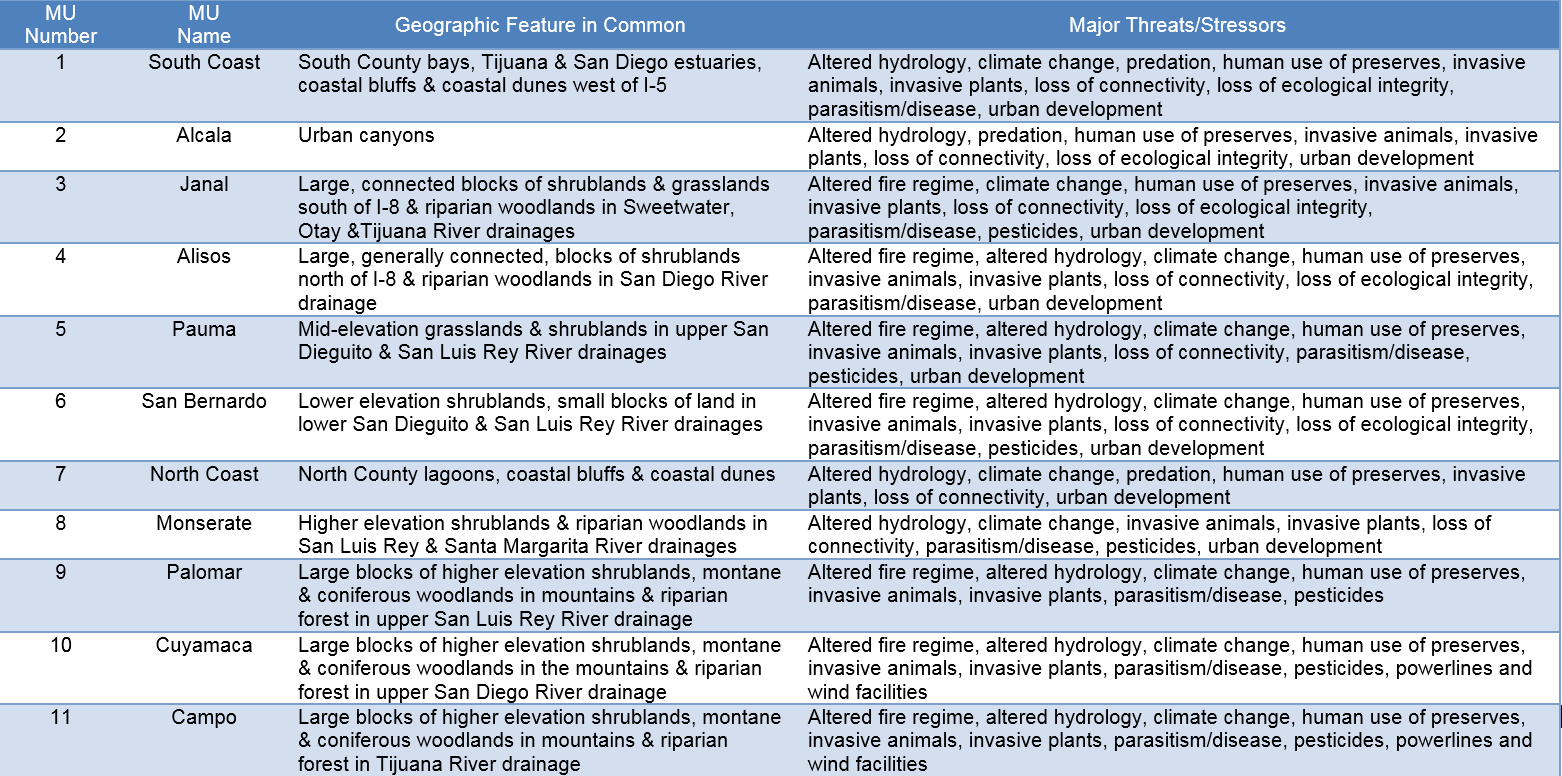
The MSPA was divided into 11 MUs to facilitate coordinated management across multiple preserves. Selection of MU boundaries followed 5 general rules. First, contiguous Conserved Lands and preserves with a single landowner were kept together. Second, the MU boundaries were drawn to avoid fragmenting core areas, and to aggregate them where appropriate. Third, MUs aggregate similar geographic features, vegetation communities, and major threats/stressors. Fourth, linkages were included in the most appropriate MU based on species, vegetation communities, goals, and objectives. Finally, dividing lines typically follow major roads to reduce confusion on the ground by creating an intuitive boundary. Management units are identified by number. The MU names, geographic features in common, and major threats/stressors are provided in Table V1.2-2.
Table V1.2-2: MU names, geographic features in common, and major threats/stressors.
The next step in developing the MSP was to characterize land area, land use, vegetation, and a variety of threats/stressors across the MSPA and for each MU specifically. The following sections describe the approach used to characterize the MSPA and MUs. The results of the characterization of land area, land use, and vegetation are presented in Vol. 1, Sec. 3.0. The results of the characterization of threats and stressors are presented in Vol. 2B.
Using GIS software and the 2015 San Diego County Land Use digital data layer (SANDAG 2015), maps were prepared and acreages of different land use categories were calculated for the MSPA and for each MU. Some of the land use information is based on parcel zoning classifications, not actual land use. For example, a 5-acre parcel that is zoned as low-density residential will likely have a large amount of open space on the lot, with only a small piece developed for a house. However, in some jurisdictions, the entire parcel will be labeled as urban. Therefore, it will overestimate the acreage of land that is actually built upon. SANDAG maintains a digital database of Conserved Lands within San Diego County (SANDAG 2016). Conserved Lands are defined as undeveloped parcels with a legal conservation mechanism in place. The layer does not rank properties based on the quality of habitat that is provided. This was used to prepare maps of Conserved Lands and to calculate acreages for the MSPA and for the various MUs. Acreages of land owned by various entities were also calculated for the MSPA and for MUs in GIS.
Vegetation types were calculated using the 2012 SANDAG/AECOM vegetation layer (SANDAG 2012), merged with the 2015 CalVeg layer (USFS 2015). The 2012 SANDAG/AECOM map was used as the primary source of information. Where gaps exist in this mapping effort, the CalVeg layer was inserted. Crosswalks for both vegetation sources were created to create 11 vegetation categories that will be used throughout the MSP. Reclassification and acreage calculations were done in GIS. Vegetation and land use acreages may be divergent due to the different collection methods. The vegetation data do not include zoning information, instead it classifies the current vegetation without regard for ownership or potential for development.
Patches of contiguous habitat were calculated for the MSPA and each MU. Contiguous habitat was defined as undeveloped areas that were not bisected by a major road or other urban barriers, regardless of conservation status. The vegetation data set described above was used to determine undeveloped areas. However, the resolution of the vegetation data was not high enough to distinguish many major roads, which cause significant gaps in usable habitat. To account for this, the Southern California Roads layer was used to identify major roads (classes 1 through 6 of the California Road System Functional classification) (Caltrans 2016). Polygon road information was not available, so major road lines were buffered by 3 meters (radius) to represent the break in habitat. Patches that were smaller than 1 acre were excluded because the minimum mapping unit for both vegetation layers was not large enough to properly distinguish patches this small.
Patch size calculations for MUs did not cut patches that crossed MU boundaries. All patches at least partially in a particular MU were wholly considered in the average patch size. Therefore, patches that cross MU boundaries were included in multiple MUs calculations. Calculations for the MSPA (total number of patches and average patch size for the MSPA) do not count any patch more than 1 time.
Patches of Conserved Lands used the same vegetation data to determine habitat. But the patches were limited to only conserved areas of natural vegetation. As a result, any conserved areas that were mapped as agriculture, urban, or San Diego or Mission Bay were not included in the patch size calculations.
Hydrology information was collected from the National Hydrography Dataset (NHD) (USGS 2016), downloaded in February of 2016. This dataset included stream lines, artificial flow lines, watershed boundaries, and bodies of water. Maps and acreages were created in GIS.
The fire history for each MU was calculated in GIS using the California Department of Forestry and Fire Protection (CAL FIRE) Fire Resource and Assessment Program (FRAP) mapping GIS data, "Fire Perimeters" (CAL FIRE 2015). This database includes the fire perimeter, year, and name of the fire for all fires through 2015. An additional fire perimeter was added in for the Border Fire that occurred in June 2016 and burned 7,600 acres along the U.S-Mexico border, near Potrero. This boundary was provided by the CAL FIRE emergency active fire maps (San Diego County Emergency Site 2016).
The next step in developing the MSP was to compile a list of species to be included in the MSP Roadmap along with background information. As mentioned in Sec. 1.6, the intent of the EMP is to provide support to San Diego NCCPs in the implementation of regional monitoring and management; thus, the covered species lists from each of the plans (i.e., MSCP, MHCP, and draft NCP 2010) were included in the MSP Roadmap. Since the NCP is not finalized yet, the covered species list from the 2010 draft version was used but is expected to change. The MSP Roadmap is a living document and therefore adjustments to species included may occur in the future as needed and as determined appropriate through discussions with stakeholders.
As part of the process of selecting a final list of MSP species for the MSP Roadmap, multiple stakeholders were provided opportunities for both verbal and written input. As a result of stakeholder input, Mexican flannelbush (Fremontodendron mexicanum) and Jennifer’s monardella (Monardella stoneana) were added to the MSP species list due to their rare status in San Diego County. Ten species were excluded because of any of the following reasons: the species no longer occurred in the MSPA, insufficient data were available to develop management goals and objectives, or taxonomic revisions lumped the species with more common taxa so it is no longer a conservation priority (see Table V1.1-1 in Sec. 1.6). Harbison’s dun skipper (Euphyes vestris harbisoni) was initially excluded from the MSP species list in 2013 because of insufficient information on its status. However, monitoring data are now available and the species was found extant at a number of locations within the MSPA. Management and monitoring objectives have been included for Harbison’s dun skipper in the MSP Roadmap.
For each of the 111 MSP species included in the MSP Roadmap, relevant biological information was compiled on overall distribution and status, degree of endemism, threats/stressors, life history attributes, demographics, ecology, genetics, management needs, and available BMPs. In addition, specific information was compiled for all known occurrences on Conserved Lands in the MSPA. This information included the occurrence location, landowner, land manager, status (e.g., number of individuals, areal extent), threats, management history, and management needs.
Species information was obtained from existing species accounts, species profile webpages, published scientific papers, management plans, biological reports, baseline survey reports, monitoring databases, conceptual models, and USFWS 5 year reviews; critical habitat designations; listing decisions; and recovery plans. Plan documents, such as the MSCP Vol. II Appendix A (City of San Diego 1995), MHCP Vol. II (SANDAG 2003), draft NCP (County of San Diego 2010), and the San Diego MSCP Status Report (USFWS, CDFG, and SDMMP 2012), were important sources of information regarding species distribution and status. Information on species occurrences were also compiled from databases maintained by the County of San Diego (SANGIS/SANBIOS), City of San Diego (rare plant monitoring, vernal pool inventory), California Natural Diversity Database (CNDDB), Consortium of California Herbaria (CCH), the San Diego Natural History Museum (Bird and Plant Atlases), U.S. Geological Survey (USGS), CDFW, USFWS, and land managers (e.g., Center for Natural Lands Management). Species information was also obtained from species experts, knowledgeable local biologists, land managers, and wildlife agency staff.
Species profiles were developed from the compiled information (see Vol. 3) and specific data for known occurrences were compiled into the "MSP Species Master Occurrence Matrix databases" or "MSP-MOM" for plants and for animals; (see Vol. 1, Sec. 4.0, Data Management, for more information). Data in MSP-MOM plant and animal databases were used to designate management categories, identify occurrences important for management, develop management goals and objectives, and prioritize implementation of management actions. MSP-MOM will continue to be used to track each species’ status and distribution in the MSPA over time.
MSP species were assigned to 1 of 2 management focus groups (Species Management Focus or Vegetation Management Focus) based upon the compiled background information and an assessment of the types of management actions that would be necessary for continued persistence in the MSPA (Figure V1.2-5). Within each management focus group, species were further classified into management categories based on risk of loss. The management focus groups and categories are further described below. Refer to Table V1.1-1 in Sec. 1.6 for a complete list of MSP species and their management focus groups and categories. In the MSP Roadmap, changes were made to the 2013 MSP management categories for several species based on updated information on species status or threat risk (Table V1.1-1).
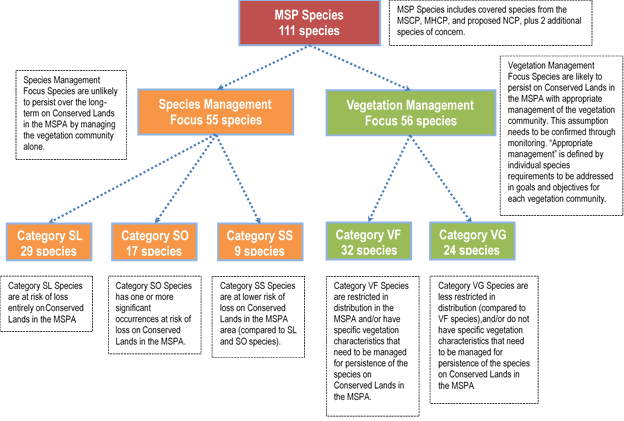
Figure V1.2-5. MSP Roadmap Management Focus Groups and Categories.
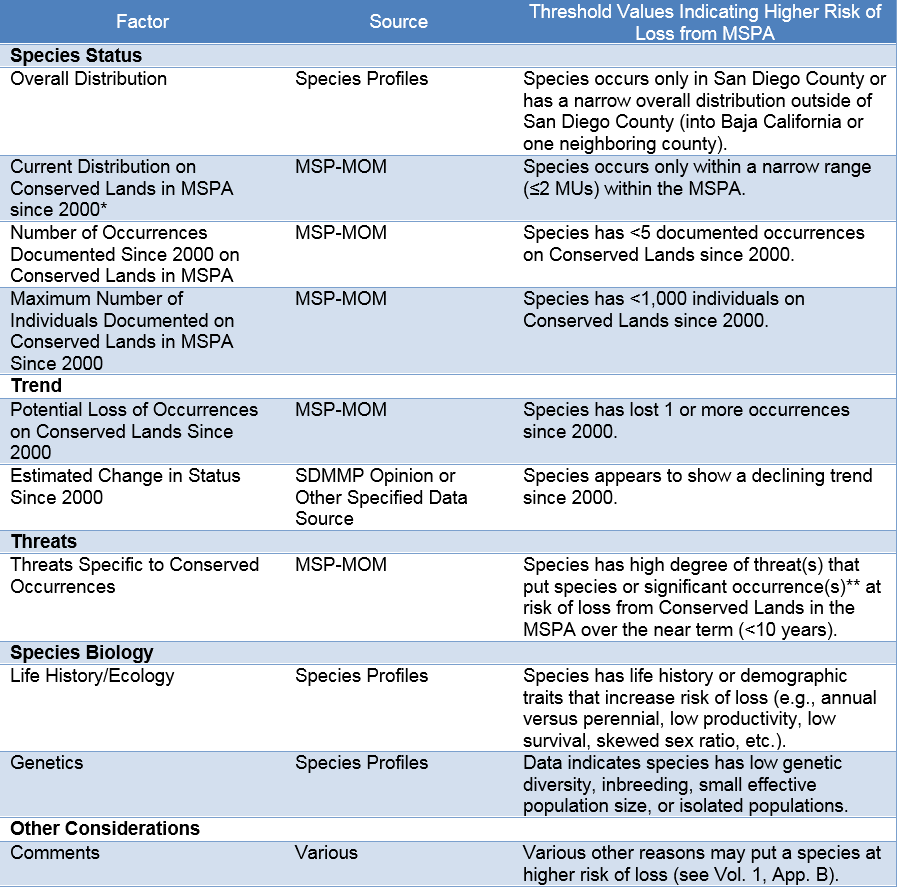
Fifty-six species were assigned to the Species Management Focus group because it is unlikely that managing the vegetation community alone will ensure the species will persist over the long term on Conserved Lands in the MSPA. Species designated as Species Management Focus were further divided into 3 categories (SL, SO, and SS; see definitions below) based on potential risk of loss of the species entirely from the MSPA, or on risk of loss of significant occurrences from the MSPA. The determination of a species’ risk of loss was evaluated for each species individually and was based on status, trend, threats, species biology, and other considerations (Table V1.2-3). Threshold values representing a higher risk of loss were specified for each factor. The greater the number of factors with higher risk values as well as the particular combination of these factors determined the species overall risk of loss and assignment to an appropriate management category. The rationale for each species management categorization and the key factors thought to be most important in determining the risk of loss of that species from the MSPA were identified in the 2013 MSP (Table V1.2-4); this table was not revised for the MSP Roadmap.
Table V1.2-3.Factors, data sources, and threshold values used to determine risk of loss from the MSPA for Species Management Focus Group Species. Multiple and combinations of high risk of loss factors were evaluated and used to assign species to management categories.
"Category SL" species are species whose persistence in the MSPA is at high risk of loss without immediate management action above and beyond that of daily maintenance activities. "Category SO" species are species whose persistence of 1 or more significant occurrences in the MSPA is at high risk of loss without immediate management action above and beyond that of daily maintenance activities. "Category SS" species are species with occurrences considered more stable and their persistence is at lower risk of loss compared to SL and SO species; however, these species still require species-specific management actions.
A significant occurrence was defined by 1 of the following criteria: relatively abundant at a distinct location or site; sustainable, as indicated by repeated observations over time or evidence of reproduction; important for ensuring connectivity; or representing the only occurrence or 1 of only few occurrences remaining in the MSPA. Significant occurrences were identified within the context of the species distribution and abundance with the MSPA. Significant occurrences identified in the MSP may or may not be the same as those identified as "core," "major," or "critical" populations in the MSCP or MHCP. A comparison of these occurrences/populations in regard to the term used still needs to be undertaken.
Based upon the evaluation criteria, 31 species were assigned to "Category SL"; 16 species were assigned to "Category SO"; and the remaining 9 species were assigned to "Category SS."
Fifty-five species were assigned to the Vegetation Management Focus group because they are likely to persist on Conserved Lands in the MSPA with appropriate management of the vegetation community; this assumption needs to be confirmed through monitoring. "Appropriate management" is defined by individual species requirements to be addressed in the goals and objectives for each vegetation community. Vegetation Management Focus group species were further divided into 2 categories (VF and VG; Figure V1.2-5). Species with limited distribution in the MSPA and/or having specific vegetation characteristics that need to be managed for persistence in the MSPA were designated as "Category VF" species (31 species). Species with a wider distribution in the MSPA or that do not have specific vegetation characteristics that need to be managed for were designated as "Category VG" species (24 species).
Category VF species will be managed within the vegetation community with which they are most often affiliated. As an example, coastal sage scrub in MU3 will be managed for specific vegetation characteristics needed by coastal sage scrub VF focus species: cliff spurge, San Diego barrel cactus, snake cholla, Blaineville’s horned lizard, California gnatcatcher, and black-tailed jackrabbit at locations necessary to meet the goals and objectives for the species. Managed locations will also include a buffer area to allow for meta-population dynamics of expansion and contraction and will be selected in collaboration with preserve managers. The specific vegetation characteristics for management will be developed over time by analyzing monitoring data that include habitat and vegetation covariates. An example of coastal sage scrub VF species monitoring is the coastal California gnatcatcher (see Vol. 2C, Sec. 2.0). A post-fire recovery study was initiated in 2015 and regional/subregional monitoring in 2016 to determine the current occupancy patterns of this species across the MSPA. Field-collected vegetation data along with GIS-derived environmental metrics will be used to model habitat relationships related to gnatcatcher occupancy. These results will determine if and where management of coastal sage scrub is needed to assist in recovery of degraded habitat and will inform specific plant pallete and restoration design recommendations to restore high-quality gnatcatcher habitat.
The Category VG coastal sage scrub species are expected to benefit from management of the coastal sage scrub vegetation community for Category VF species but will not be the focus of management.
Management and monitoring goals, objectives, and actions were developed to improve the likelihood of MSP species persistence on Conserved Lands in the MSPA. Goals, objectives, and actions were developed in accordance with guidelines in the USFWS handbook for writing management goals and objectives for refuges (USFWS 2004). The handbook defines a goal as "…a descriptive, open-ended, and often broad statement of desired future conditions that conveys a purpose, but does not define measurable units." Objectives lay out those management and monitoring actions that are required to achieve the goal. The handbook defines an objective as "a concise statement of what we want to achieve, how much we want to achieve, when and where we want to achieve it and who is responsible for the work." Each objective is to be specific, measurable, achievable, results-oriented, and time-fixed (SMART). Actions are strategies that might be undertaken to achieve the objectives.
MSP Roadmap goals are generally developed to reflect desired outcomes that extend far into the future (>100 years). Goals and objectives are developed for the entire MSPA, as well as for specific MUs where management of target groups (i.e., species, vegetation, threats/stressors) is critical or differs from management in other areas. In this approach, multiple objectives reflecting different types of management and monitoring activities are incrementally implemented as a strategy over time to achieve the target group’s goal. Objectives explicitly specify the minimum management or monitoring activities to be implemented. Additional discretionary actions are recommended that provide guidance to accomplish the objective. It is expected that the management and monitoring approach (strategy) for a target of interest and the objectives to implement it will change over time. These changes can be due to changes in the impacts of threats/stressors and responses of the management and monitoring target; a greater understanding of species and ecosystems as critical uncertainties are addressed, although new knowledge gaps may arise; improvement in management and monitoring methods as they are refined or replaced; and many other factors affecting the success of management actions. The tracking of goals, objectives, and actions as they are completed and/or changed will be documented in the MSP Portal.
MSP Roadmap objectives are composed of a number of different components that achieve the SMART objective criteria and are included within the goals and objectives tables for each management and monitoring target. Objectives are developed primarily to manage and monitor threats/stressors to reach management goals over time; each objective is based on 1 or more threats/stressors identified as potentially requiring monitoring or management actions. These threats are described in the management and monitoring approach for each species and vegetation community, in the threats text sections, and are listed in goals and objectives tables. The objectives describe what is to be accomplished, the timeline for implementing the objective within the 2017–2021 planning cycle, and short-term success criteria with a timeframe, either that of the current planning cycle or extending into the 2022–2026 planning cycle. All objectives have been designed to be achievable over time. In many cases, an objective is indicated as being implemented over a range of years, although it is recognized that implementation may occur in a part or all of that time period.
There are several steps to identify where objectives should be implemented. First, the universe of potential monitoring and management for the monitoring target is identified. For species, this universe includes the combined vegetation communities intersected with other habitat features inhabited by the species or modeled potential habitat. For vegetation objectives, the broadest scale is the distribution of the vegetation community under current conditions and it can be expanded to include future projected conditions as applicable. For threats/stressors, the entire management extent includes those areas where the threat/stressor is documented or predicted to occur, which can include the entire MSPA, MUs, or very specific locations within the MSPA. The second step is classifying an objective as "regional", "local", or "regional and local", to further define the geographic area of implementation. "Regional" and "regional and local" objectives generally apply to multiple MUs or preserves and/or where the activity benefits the entire species or region. "Local" objectives generally apply to individual preserves or a restricted area at a preserve and/or where the activity is primarily focused on the conservation of the species by land managers at the preserve level. Third, specific areas may be identified for implementing an objective based upon specific criteria.
IMAs may be defined for species, vegetation communities, or threats. For species, IMAs often consist of a species location buffered by a radius of some distance that has ecological or management relevance. Within this buffer, only Conserved Lands are used to create the IMA polygons. There are alternative methods for defining an IMA, which if used are defined in the management and monitoring approach for the species, vegetation community, or threat. This process can be implemented in similar ways for vegetation communities and threats.
An Implementation Entity/Organization will be identified to provide the leadership for ensuring that an objective is completed. The regional and local classifications provide guidance on the type of entities or organizations that should oversee implementation of the objective. The Implementation Entity/Organization will coordinate the completion of the objective and may or may not actually implement it. Multiple partners may work on completing objectives, particularly those regional in nature. Refer to Vol. 1, Sec. 5.0 for more discussion on coordination and implementation of the MSP.
Table V1.2-5 lists the types of objectives used for monitoring and managing species, vegetation, and threat/stressor target groups along with the sequence of codes identifying the objective and a brief definition. Some objectives are used interchangeably between the management and monitoring target groups, whereas other objectives may apply to just one. Objectives have codes for different fields that, when combined, form a code sequence. Objectives are first identified as to their fire status. Objectives unrelated to fire monitoring or management are considered "not a fire objective" (NFO). Objectives applying to fire management or monitoring are identified as occurring pre-fire (PRE), during the fire suppression period (SUPP) or post-fire (POST). All objectives are designated as management (MGT) or monitoring (MON) type, followed by a 3- to 6-letter objective code. A 3-6 letter objective modifier provides more specificity to the objective, designating for example a management plan versus a monitoring plan. For example, the code sequence for preparing a non-fire related management plan is NFO-MGT-PRP-MGTPL; implementing is NFO-MGT-IMP-MGTPL; and monitoring implementation is NFO-MON-IMP-MGTPL. The code sequence for preparing a seed collection, banking and, bulking plan is NFO-MGT-PRP-SBPL; implementing is NFO-MGT-IMP-SBPL; and monitoring implementation is NFO-MON-IMP-SBPL. The codes are primarily useful for querying and tracking objectives in the MSP Portal databases but it is not necessary for the casual user to know these codes.
Table V1.2-5.MSP Roadmap management and monitoring codes for species, vegetation, and threat objectives.
Methods used to develop goals and objectives for the target management and monitoring groups are briefly described below. The general management and monitoring approach is explained above in Sec. 2.4., while the specific approach and goals and objective for each species, vegetation community, threat/stressor, and regional preserve system are presented in Vol. 2 (A through D).
Goals and objectives were developed for the 56 Category SL, SO, and SS species in the Species Management Focus Group for the 5-year MSP Roadmap planning cycle from 2017–2021 (see Vol. 2D, MSP Portal, and the Priority Objectives Timeline: MSP Objectives). For each species, the following information was compiled, evaluated, and included in that species’ text section of the MSP Roadmap and posted on each species’ summary page on the MSP Portal. The text section includes MUs with known occurrences, management categorization rationale, overview of the management and monitoring approach, and a table of species occurrences. Tables of species occurrences identify IMAs and typically list preserves, preserve owners, and managers within the IMAs, and often contain population or threats information. Altered Fire Regime IMAs are specified for species prioritized at high risk from wildfire (Vol. 2B, Sec. 2.0). Altered Fire Regime IMAs are based upon specific criteria (e.g., number of fires since 2000, modeled probability of ignition) and overlaid on a species’ IMA polygons to identify areas important for PRE-, SUPP, or POST fire management. For each species, there is a link to an online map viewer showing species occurrences, IMAs, and, if applicable, fire IMAs.
After compiling all available information, a management approach or strategy was developed that considered, at a minimum, a species’ status and distribution, ecology and life history traits, and the type and magnitude of threats. For species with little available information, initial objectives typically included surveys to gather species status, habitat, and threat data to determine management needs. Targeted studies are often performed early in a species’ management strategy to gather information about critical uncertainties that could apply to the species management. The types of information needed vary depending on the species, but could include targeted studies to address topics such as population genetics, population responses to threats, BMPs, dispersal and daily movements, habitat use and requirements, species interactions, foraging and food availability, and demography. Once sufficient data are available, the next step is to develop a management plan prioritizing occurrences and management actions. A long-term monitoring plan is often developed to track changes in a species distribution and population dynamics over time and in relation to habitat and threat covariates. After a management plan is created, the next step is to implement high-priority management actions and monitor to determine their effectiveness. Objectives are often prioritized by the timing of their implementation, with a greater investment in monitoring and managing species ranked at higher risk before lower-ranked species. As a result, some species or specific management and monitoring objectives have been deferred to the next planning cycle. In preparing the 2022–2026 planning cycle, there will be an assessment of what has been learned from 2017–2021 monitoring and management implementation before preparing the next round of objectives. Each species’ summary page on the MSP Portal has a link to the 2017–2021 goals and objectives.
Monitoring and management approaches, goals and objectives, and timelines for implementation have been developed for several vegetation communities in the MSPA (Vol. 2C; and the Priority Objectives Timeline: MSP Objectives A long–term monitoring plan will be developed to collect data on the composition, structure, and ecological integrity of coastal sage scrub, chaparral, and grassland vegetation communities across the MSPA. Landscape-scale ecological integrity classification maps will be developed using remote imagery to guide the vegetation sampling design and then to assess changes in the status of the preserve system over time. The vegetation monitoring is part of a larger project to track coastal sage scrub, chaparral, and grassland ecosystems over time to determine responses to threats/stressors and changing environmental conditions. The approach involves synthesizing and analyzing monitoring data collected on plant and animal communities, threats, and abiotic factors. This approach is more fully explained in Vol. 1, Sec. 2.2 and Vol. 2A.
Other vegetation monitoring objectives include documenting tree mortality and recruitment in woodland and forest vegetation communities in response to large mortality events caused by drought, pests, and fungal pathogens. This will entail compiling existing mapping and assessments of landscape-scale tree mortality. Where such information is not available, the objective is to use a combination of aerial imagery and LIDAR (Light Detection and Ranging) to map tree mortality across the MSPA. This landscape-scale assessment is planned for oak woodland, riparian forest and scrub, Torrey pine forest, and Tecate cypress forest vegetation communities. Field-based monitoring plans will be prepared and implemented for oak woodland and riparian forest and scrub vegetation that focus on sampling recruitment, mortality, and assessing threats.
For VF species monitoring, the initial focus will be on collecting data to determine the species status and distribution, to characterize habitat components, to assess threats, and to develop BMPs to reduce threats at a landscape-scale (see Vol. 2C and the Priority Objectives Timeline: MSP Objectives. As feasible, VF species monitoring will be integrated into the overall vegetation community monitoring. After collecting VF species data, the next step will be to use the ecological integrity mapping, vegetation mapping, monitoring data, threat assessments, and habitat analyses to develop VF species vegetation management plans. These plans will include explicit goals and objectives that specify the size (acreage), location, and configuration of vegetation communities to be managed within the MSPA. These objectives will also specify the type of management based on testing of BMPs and establish criteria for achieving desired vegetation conditions associated with the VF species that are the target of management. Locations where vegetation communities will be managed will require collaboration with preserve managers and will depend on locations of significant occurrences of the VF species. VG species are expected to benefit from management of vegetation communities for VF species but will not be targeted specifically for management.
Management goals and objectives were developed for those threats/stressors that may have the most severe and widespread impacts on MSP species and vegetation communities. Threats/stressors with objectives in the 2017–2022 planning cycle (Vol. 2B) include altered fire regime, altered hydrology, climate change, herbivory/predation, human use of preserves, invasive animals, invasive plants, loss of connectivity, loss of ecological integrity, pesticides (includes herbicides, pesticides, and rodenticides), and urban development. Threat/stressor objectives expand upon or complement the management actions identified in species and vegetation community goals and objectives. Regional threat management will benefit a suite of species.
Most species and vegetation monitoring protocols now include collection of threat covariate data to determine the type and magnitude of threats and identify management needs at species occurrences or vegetation community locations. When site-specific threat data are not available, existing threat information was used to develop species, vegetation, and threat management goals and objectives where possible; in many instances, data were inadequate to support the development of specific objectives and/or actions. In these instances, it was necessary to gather additional data to identify and characterize threats to inform management objectives with specific actions to reduce threats to benefit MSP species or vegetation communities. Where possible, the areal extent of the threat/stressor is calculated based upon mapping and if that is not available then from modeling using information from the relevant literature and from data collected in species or vegetation monitoring. There are also several threat monitoring objectives, to fill information gaps regarding the spatial distribution and magnitude of certain types of threats across the MSPA.
The final step in developing the MSP Roadmap was to prioritize the implementation of management and monitoring objectives over a 5-year calendar year planning cycle (see Strategic Plan Tracking Database (SP-Tracker) output at:MSP Objectives. Management and monitoring prioritization is based upon the central tenet of the MSP Roadmap: MSP species should not be lost from the MSPA. The timing of management and monitoring objectives for each species is prioritized based upon the determination of the species risk of loss from the MSPA, an assessment of threats facing conserved populations, feasibility and effectiveness of management in reducing these threats, economies of scale that could be achieved by combining management and monitoring actions for multiple species, and whether the species was already the focus of an ongoing management or monitoring project.
Management and monitoring objectives for threats (Vol. 2B; see SP-Tracker output link above) are prioritized based on threat risk to MSP species, vegetation communities, and ecosystem processes; based on completion of other objectives upon which that objective depends; and based on ongoing threat monitoring or management projects.
Vegetation communities and VF species are prioritized for monitoring and management by timing implementation of the objectives. Monitoring objectives are conducted prior to management objectives for vegetation communities to gather information on their status, distribution, composition, structure, ecological integrity, and management need. BMPs will need to be developed before management plans can be implemented. Similarly for the VF species, monitoring is prioritized to determine the distribution, status, habitat relationships, threat risks, and management needs. This information is then used to inform development of vegetation management and VF species management plans. Vegetation communities receiving the highest priority for monitoring and management are those that support VF species of high conservation concern, are faced with a high level of threats, require development of BMPs at the landscape-scale, and are not already the focus of extensive management by other entities. VF species are the focus of monitoring and management within vegetation communities. The 2017–2021 planning cycle largely focuses on monitoring objectives for selected vegetation communities and VF species, with management objectives largely deferred to future planning cycles. Not all vegetation communities or VF species can be monitored or managed in the 2017–2021 planning cycle, so many vegetation and VF species monitoring and management objectives are deferred to future planning cycles. VG species may incidentally benefit in areas where vegetation is being managed for VF species.
Species designated as having a higher risk of loss entirely from the MSPA (Category SL) or loss of significant occurrences (Category SO) are given the highest priority for action in 2017-2021 (Vol. 2D). In most cases, management and monitoring actions for SL and SO species are to be initiated as soon as a management or monitoring plan is developed. The management plan takes all available data critical to management and then prioritizes and identifies management actions that fit within the management approach or strategy to achieve the long-term goal. In some cases, there are species for which ongoing management or an urgent need for management is implemented in the absence of a management plan. For many species and vegetation communities, it is necessary to complete information gathering objectives or other tasks before the management plan is developed. These types of information gathering objectives include baseline surveys; preparing and implementing a monitoring plan to gather data on occurrence status, habitat relationships, and habitat assessments; seed collection, banking, and bulking plans; genetic studies; research studies; and BMP development. In these cases, these objectives will be initiated earlier in the planning horizon and management phased in as practicable. For those species with sufficient data and in which management actions are not contingent on the completion of other tasks, management plans will be developed as soon as is feasible. Objectives to develop monitoring plans and implement monitoring objectives may be timed before or after the management plan is prepared, depending on information needs. Preparing management and monitoring plans for SL and SO species is the highest priority followed by SS species for which there are ongoing projects being implemented. Species whose management or monitoring plans are not developed in the 2017–2021 planning cycle will be deferred to the next planning cycle.
Atkinson, A. J., P. C. Trenham, R. N. Fisher, S. A. Hathaway, B. S. Johnson, S. G. Torres, and Y. C. Moore. 2004. Designing Monitoring Programs in an Adaptive Management Context for Regional Multiple Species Conservation Plans.
Barr, K. R., B. E. Kus, K. L. Preston, S. Howell, E. Perkins and A. G. Vandergast. 2015. Habitat Fragmentation in Coastal Southern California Disrupts Genetic Connectivity in the Cactus Wren (Campylorhynchus brunneicapillus). Molecular Ecology 24:2349-2363.
Brook, B. W., N. S. Sodhi, and C. J. A. Bradshaw. 2008. Synergies Among Extinction Drivers Under Global Change. TRENDS in Ecology and Evolution 23:453-460.
Brown, C., S. A. Hatahway, and R. N. Fisher. 2012. Data Summary for the TransNet Environmental Mitigation Program Grant Agreement 5001140 Regarding Southwestern Pond Turtle Restoration at Sycuan Peak Ecological Reserve, March 2012. U. S. Geological Survey Data Summary Prepared for the TransNet Environmental Mitigation Program, San Diego, CA, 20 pp.
Brown, C., M.C. Madden, A. N. Aguilar Duran, and R. N. Fisher. 2015. Western Pond Turtle (Emys marmorata) Restoration and Enhancement in San Diego County, CA, 2013-2015. Data Summary. Prepared for the San Diego Association of Governments, San Diego Management and Monitoring Program, and California Department of Fish and Wildlife, San Diego, CA, 119 pp.
Butchart, S. H. M., M. Walpole, B. Collen, A. van Strien, J. P. W. Sharlemann, R. E. A. Almond, J. E. M. Baillie, B. Bomhard, C. Brown, J. Bruno, K. E. Carpenter, G. M. Carr, J. Chanson, A. M. Chenery, J. Csirke, N. Davidson, F. Dentener, M. Foster, A. Galli, J. N. Galloway, P. Genovesi, R. D. Gregory, M. Hockings, V. Kapos, J.F. Lamarque, F. Leverington, J. Loh, M. A. McGeoch, L. McRae, A. Minasyan, M. Hernández Morcillo, T. E. E. Oldfield, D. Pauly, S. Quader, C. Revenga, J. R. Sauer, B. Skolnik, D. Spear, D. Stanwell-Smith, S. N. Stuart, A. Symes, M. Tierney, T. D. Tyrell, J.C Vié, and R. Watson. 2010. Global Diversity: Indicators of Recent Declines. Science 328 No. 5982:1164-1168.
CAL FIRE Fire and Resource Assessment Program (FRAP). 2015. Fire Perimeters Version 15_1. http://frap.fire.ca.gov/data/frapgisdata-sw-fireperimeters_download. Accessed September 2016.
Caltrans data library. 2016. Unofficial Functional Classification. http://www.dot.ca.gov/hq/tsip/gis/datalibrary/. Accessed November 2016.
City of San Diego. 1995. Multiple Species Conservation Program (MSCP) Volume II: Appendix A – Biological Resources. Prepared by Ogden Environmental and Energy Services Co., the Rick Alexander Company, Onaka Planning and Economics, Douglas Ford and Associates, Sycamore Associates, SourcePoint and CESAR. Prepared for the City of San Diego.
City of San Diego. 1998. Final Multiple Species Conservation Program: MSCP Plan.
Conlisk, E., S. Motheral, R. Chung, C. Wisinski, and B. Endress. 2014. Using Spatially-explicit Population Models to Evaluate Habitat Restoration Plans for the San Diego Cactus Wren (Campylorhynchus brunneicapillus sandiegensis). Biological Conservation 175:42-51.
Cook, C. N., K. De Bie, D. A. Keith, and P. F. E. Addison. 2016. Decision Triggers are a Critical Part of Evidence-based Conservation. Biological Conservation 195:46-51.
Côté, I. M. , E. S. Darling, and C. J. Brown. 2016. Interactions Among Ecosystem Stressors and Their Importance in Conservation. Proceedings of the Royal Society B 283:20152592. http://dx.doi.org/10.1098/rspb.2015.2592.
County of San Diego. 1997. Multiple Species Conservation Program: County of San Diego Subarea Plan.
County of San Diego. 2010. Draft North County Multiple Species Conservation Plan Conservation Analysis.
Deutschman, D. H., M. E. Berres, D. A. Marschalek, and S. L. Strahm. 2011. Two Year Evaluation of Hermes Copper (Lycaena Hermes) on Conserved Lands in San Diego County. Prepared for San Diego Association of Governments, MOU #5001442.
Deutschman, D. and S. McCullough. 2012. Monitoring and Adaptive Management of Burrowing Owl on Conserved Lands in Southern San Diego County. Report Prepared for San Diego Association of Governments, Contract Amendment 4 to #5001562, 27 pp.
Deutschman, D. and S. McCullough. 2015. Monitoring and Adaptive Management of Burrowing Owl on Conserved Lands in Southern San Diego County, Task F: Data Analysis and Final Report. Report Prepared for San Diego Association of Governments, Contract Amendment 7 to #5001562, 24 pp.
Doblas-Miranda, E., J. Martínez-Vilalta, F. Lloret, A. Álvarez, A. Ávila, F. J. Bonet, L. Brotons, J. Castro, J. Curiel Yuste, M. Díaz, P. Ferrandis, E. García-Hurtado, J. M. Iriondo, T. F. Keenan, J. Latron, J, Llusià, L. Loepfe, M. Mayol, G. Moré, D. Moya, J, Peñuelas, X. Pons, R. Poyatos, J, Sardans, O. Sus, V. R. Vallejo, J. Vayreda, and J. Retana. 2015. Reassessing Global Change Research Priorities in Mediterranean Terrestrial Ecosystems: How Far Have We Come and Where Do We Go From Here. Global Ecology and Biogeography 24:25-43.
Dobson, A. P., J. P. Rodriguez, W. M. Roberts, and D. S. Wilcove. 1997. Geographic Distribution of Endangered Species in the United States. Science 275:550-553.
Ernest, H. B., T. W. Vickers, S. A. Morrison, M. R. Buchalski, and W. M. Boyce. 2014. Fractured Genetic Connectivity Threatens a Southern California Puma (Puma concolor) Population. PLoS ONE 9(10):e107985. Doi:10.1371/journal.pone.0107985.
Hennessy, S. M., C. Wisinski, J. P. Montagne, K. Marshall, D. M. Shier, R. R. Swaisgood, and L. A. Nordstrom. 2015. Project Report 2015: An Adaptive Management Approach to Recovering Burrowing Owl Populations and Restoring a Grassland Ecosystem in San Diego County. Report Prepared for the San Diego Foundation Otay Mesa Grassland Mitigation Fund, 6649.
Hierl, L. A. , J. Franklin, D. H. Deutschman, and J. M. Regan. 2007. Developing Conceptual Models to Improve the Biological Monitoring Plan for San Diego’s Multiple Species Program. Prepared for California Department of Fish and Game.
Jennings, M. K. , R. L. Lewison, T. W. Vickers, and W. M. Boyce. 2015. Puma Response to the Effects of Fire and Urbanization. The Journal of Wildlife Management; DOI: 10.1002/jwmg.1018.
Kamada, D. and K. Preston. 2013. Nature Reserve of Orange County: Coastal Cactus Wren Dispersal and Survival Surveys, Genetics, and Parasite Sampling, and Arthropod Foraging Ecology in 2012. Final Report Prepared for California Department of Fish and Wildlife.
Karr, J.R. & Dudley, D.R. 1981. Environmental Management 5: 55. doi:10.1007/BF01866609.
Lindenmayer, D. B. and G. E. Likens. 2009. Adaptive Monitoring: A New Paradigm for Long-term Research and Monitoring. TRENDS in Ecology and Evolution 24:482-486.
Lindenmayer, D. B., G. E. Likens, A. Haywood, and L. Miezis. 2011. Adaptive Monitoring in the Real World: Proof of Concept. TRENDS in Ecology and Evolution 26:641-646.
Lindenmayer, D. B., M. P. Piggott, and B. A. Wintle. 2013. Counting the Books while the Library Burns: Why Conservation Monitoring Programs Need a Plan for Action. Frontiers in Ecology and the Environment 11:549-555.
Marschalek, D. and D. Deutschman. 2014. Rare Butterfly Management Studies on Conserved Lands in San Diego County: Hermes Copper (Lycaena hermes), Task 5: Hermes Copper Adult Monitoring, Adult and Egg Translocation 2014. Prepared for San Diego Association of Governments, Contract #5004388.
Marschalek, D. and D. Deutschman. 2016a. Rare Butterfly Management and Conservation Planning, Task 3: Hermes Copper Adult Surveys at South County Sites (Sentinel Sites and Fire Sites). Report Prepared for San Diego Association of Governments. Contract #5004388.
Marschalek, D. and D. Deutschman. 2016b. Rare Butterfly Management Studies on Conserved Lands in San Diego County: Hermes Copper (Lycaena hermes) Translocation Final Report. Report Prepared for San Diego Association of Governments. Contract #5004388.
Marschalek, D. and D. Deutschman. 2016c. Rare Butterfly Management and Conservation Planning, Task 2: Hermes Copper Adult Surveys at North County Sites. Report Prepared for San Diego Association of Governments. Contract #5004388.
Marschalek, D. A., J. A. Jesu, and M. E. Berres. 2013. Impact of Non-lethal Genetic Sampling on Survival, Longevity and Behavior of the Hermes Copper (Lycaena hermes) Butterfly. Insect Conservation and Diversity, doi:10.1111/icad.12024.
Mcdonald, R. I., P. Kareiva, and R. T. T. Forman. 2008. The Implications of Current and Future Urbanization for Global Protected Areas and Biodiversity Conservation. Biological Conservation 141:1695-1703.
McEachern, K., B. M. Pavlik, J. Rebman, and R. Sutter. 2007. San Diego Multiple Species Conservation Program (MSCP) Rare Plant Monitoring Review and Revision. U. S. Geological Survey Scientific Investigations Report 2007-5016, 68 pp.
McEachern, K. and R. Sutter. 2010. Assessment of Eleven Years of Rare Plant Monitoring Data from the San Diego Multiple Species Conservation Plan. USGS-WERC-Channel Islands Field Station Administrative Report 2010-01. Final Report for Contract 08W3CA5001030 between the U. S. Geological Survey and the San Diego Association of Governments, Ventura, California, 146 pp.
Millennium Ecosystem Assessment. 2005. Ecosystems and Human Well-being: Biodiversity Synthesis. World Resources Institute, Washington, D. C.
Miller, W. B. and C. S. Winchell. 2016. A Comparison of Point-count and Area-search Surveys for Monitoring Site Occupancy of the Coastal California Gnatcatcher (Polioptila californica californica). The Condor Ornithological Applications 118:3329-337.
Myers, N., R. A. Mittermeier, C. G. Mittermeier, G. A. B. da Fonseca, and J. Kent. 2000. Biodiversity Hotspots for Conservation Priorities. Nature 403:853-858.
Niemi, G. J. and M. E. McDonald. 2004. Application of Ecological Indicators. Annual Review of Ecology, Evolution, and Systematics 35:89-111.
Parrish, J. D., D. P. Braun, and R. S. Unnasch. 2003. Are We Conserving What We Say We Are? Measuring Ecological Integrity Within Protected Areas. BioScience 53:851-860.
Perring, M. P., P. de Frenne, L. Baeten, S. L. Maes, L. Depauw, H. Blondeel, M. M. Carón, and K. Verheyen. 2016. Global Environmental Change Effects on Ecosystems: The Importance of Land Use Legacies. Global Change Biology 22:1361-1371.
Preston, K. and B. Kus. 2015. Coastal California Gnatcatcher Proposed Regional Monitoring Sampling Design. Draft prepared July 10, 2015.
Sala, O. E., F. S. Chapin III, J. J. Armesto, E. Berlow, J. Bloomfield, R. Dirzo, E. Huber-Sanwald, L. F. Huenneke, R. B. Jackson, A. Kinzig, R. Leemans, D. M. Lodge, H. A. Mooney, M. Oesterheld, N. L. Poff, M. T. Sykes, B. H. Walker, M. Walker, and D. H. Wall. 2000. Global Biodiversity Scenarios for the Year 2100. Science 287:1770-1774.
SANDAG. 2003. Volume I: Final MHCP Plan. Prepared for Multiple Habitat Conservation Program.
SANDAG. 2012. ECO_VEGETATION_WSD_2012. Principal authors: (AECOM) Oberbauer, T., F. Sproul, J. Dunn, and L. Woolley. www.sangis.org. Accessed September 2016.
SANDAG Technical Services. 2015. LANDUSE_CURRENT. www.sangis.org. Accessed September 2016.
SANDAG Technical Services. 2016. Conserved_Lands. www.sangis.org. Accessed December 2016.
San Diego County Emergency Site. 2016. Emergency Map. http://www.sdcountyemergency.com/maps/. Accessed June 2016.
Seidl, R., T. S. Apies, D. L. Peterson, S. L. Stephens, and J. A. Hicke. 2016. Searching for Resilience: Addressing the Impacts of Changing Disturbance Regimes on Forest Ecosystem Services. Journal of Applied Ecology 53:120-129.
Shier, D. M., J. P. Montagne, S. M. Hennessy, C. Wisinski, L. A. Nordstrom, and R. R. Swaisgood. 2016. Translocation Model for the California Ground Squirrel (Otospermophilus beecheyi) to Facilitate California Grassland Ecosystem Recovery.
Tylianakis, J. M., R. K. Didham, J. Bascompte, and D. A. Wardle. 2008. Global Change and Species Interactions in Terrestrial Ecosystems. Ecology Letters 11:1351-1363.
USFS (U.S. Forest Service). 2015. EVEG Map Tile Units, Ecological Subregions and CALVEG Zones Index. Tiles 31B, 32B, 25B, 42, 43A, 43B, 44B, 44C, 47A, 47B, 48, 51A, 51B, 52, 53A, 53B, 54, 55, 59A, 59B, 60A. http://www.fs.usda.gov/detail/r5/landmanagement/gis/?cid=STELPRDB5327836. Accessed September 2016.
USFWS (U.S. Fish and Wildlife Service). 2004. Writing Refuge Management Goals and Objectives: A Handbook.
USFWS, CDFG (California Department of Fish and Game), and SDMMP. 2012. San Diego Multiple Species Conservation Program Status Report: 1997-2011.
U.S. Geological Survey (USGS). 2016. National Hydrography Dataset (NHD). http://nhd.usgs.gov/data.html. Accessed June 2016.
Underwood, E. C., J. H. Viers, K. R. Klausmeyer, R. L. Cox and M. R. Shaw. 2009. Threats and Biodiversity in the Mediterranean Biome. Diversity and Distributions 15:188-197.
Vandergast, A. G., B. E. Kus, K. R. Barr, and K. L. Preston. 2014. Genetic Structure in the California Gnatcatcher in Coastal Southern California and Implications for Monitoring and Management. Data Summary Report Prepared for the California Department of Fish and Wildlife.
Vickers, T. W., J. N. Sanchez, C. K. Johnson, S. A. Morrison, R. Botta, T. Smith, B. S. Cohen, P. R. Huber, H. B. Ernest, and W. M. Boyce. 2015. Survival and Mortality of Pumas (Puma concolor) in a Fragmented, Urbanizing Landscape. PLoS ONE 10(7):e0131490. Doi:10.1371/journal.pone.0131490.
Westman, W. E. 1981. Diversity Relations and Succession in California Coastal Sage Scrub. Ecology 62:170-184.
Winchell, C.S. and P. F. Doherty, Jr. 2008. Using California Gnatcatcher to Test Underlying Models in Habitat Conservation Plans. Journal of Wildlife Management 72:1322-1327.
Winchell, C. S. and P. F. Doherty. 2014. Effects of Habitat Quality and Wildfire on Occupancy Dynamics of Coastal California Gnatcatcher (Polioptila californica californica). The Condor 116:538-545.
Wisinski, C., J. P. Montagne, S. Marczak, D. M. Shier, L. A. Nordstrom, and R. Swaisgood. 2012. Project Report 2012: An Adaptive Management Approach to Recovering Burrowing Owl Populations and Restoring a Grassland Ecosystem in San Diego County. Report Prepared for San Diego Foundation Otay Mesa Grassland Mitigation Fund, 6649.
Wurtzebach, Z. and C. Schultz. 2016. Measuring Ecological Integrity: History, Practical Applications, and Research Opportunities. BioScience 66:446-457
Section 3.0 describes the area, land use, Conserved Land owners and managers, vegetation communities and natural patch size, hydrologic conditions, and fire history of the MSPA and each MU individually. Additional information on the methods used to calculate the following information can be found in Vol. 1, Sec. 2.6. An online map is available and contains Conserved Lands, vegetation, land use, habitat patches, and fire layers that are discussed in this section. Use this online map to view map details for each MU. The map can be found at: https://sdmmpgis.maps.arcgis.com/home/webmap/viewer.html?webmap=33bce9e204df4da9aa52859b756cb2e4.
The western portion of San Diego County (MSPA) was divided into 11 MUs that cover a total of 1,765,147 acres (Figure V1.1-1 in Sec. 1.6). The MSPA extends from the coast to the upper watershed boundaries of all the major rivers in San Diego County and from the United States (U.S.)-Mexico border to the northern San Diego County line. The MSPA does not include military land (Marine Corps Air Station Miramar, Marine Corps Base Camp Pendleton, or Fallbrook Naval Weapons Station); therefore, data from military lands are not included on the maps or in the calculations for this section.
MUs vary significantly in size (Table V1.3-1). Coastal MUs are smaller and were drawn to primarily include the beaches, bays, and lagoons. Coastal MUs contain smaller and more discontiguous preserves. MUs in the eastern portion of the MSPA are larger and contain more contiguous areas and larger patches of Conserved Lands.
Table V1.3-1. Total and Conserved Land Area of Management Units. The two highest and lowest percent conserved are highlighted.
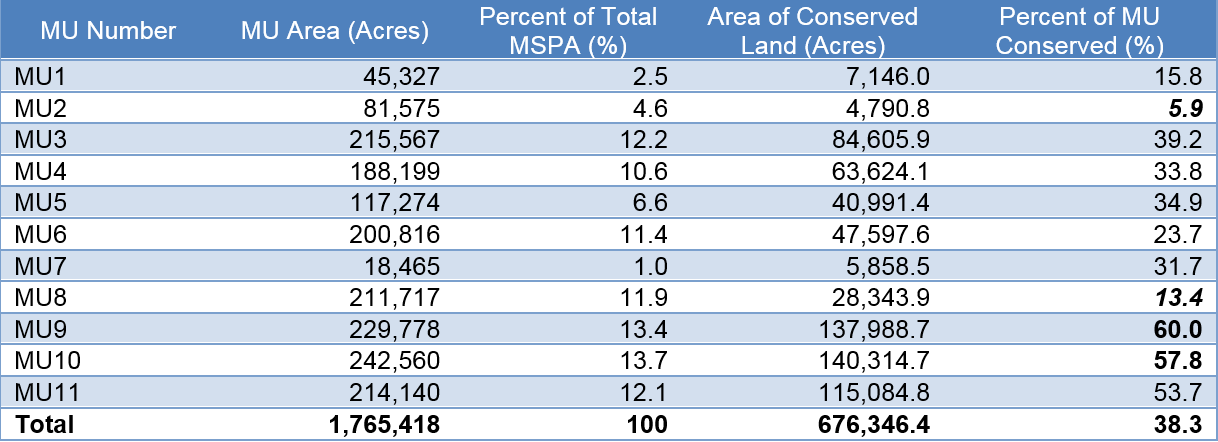
Within the MSPA, land use categories, mapped by SanGIS (2015), were collapsed into 9 general categories (Table V1.3-2). Urban areas are mainly along the coast in MUs 1, 2, and 7 (Figures V1.3-1 and V1.3-2). Urbanization in the midportion of the MSPA includes unincorporated areas such as Ramona, Alpine, and Valley Center, which are composed of rural and semi-rural development. The easternmost MUs consist mainly of large open space property with small developments in Descanso, Campo, and Warner Springs. Agriculture is primarily in the northern half of the MSPA and particularly prevalent in MU8.
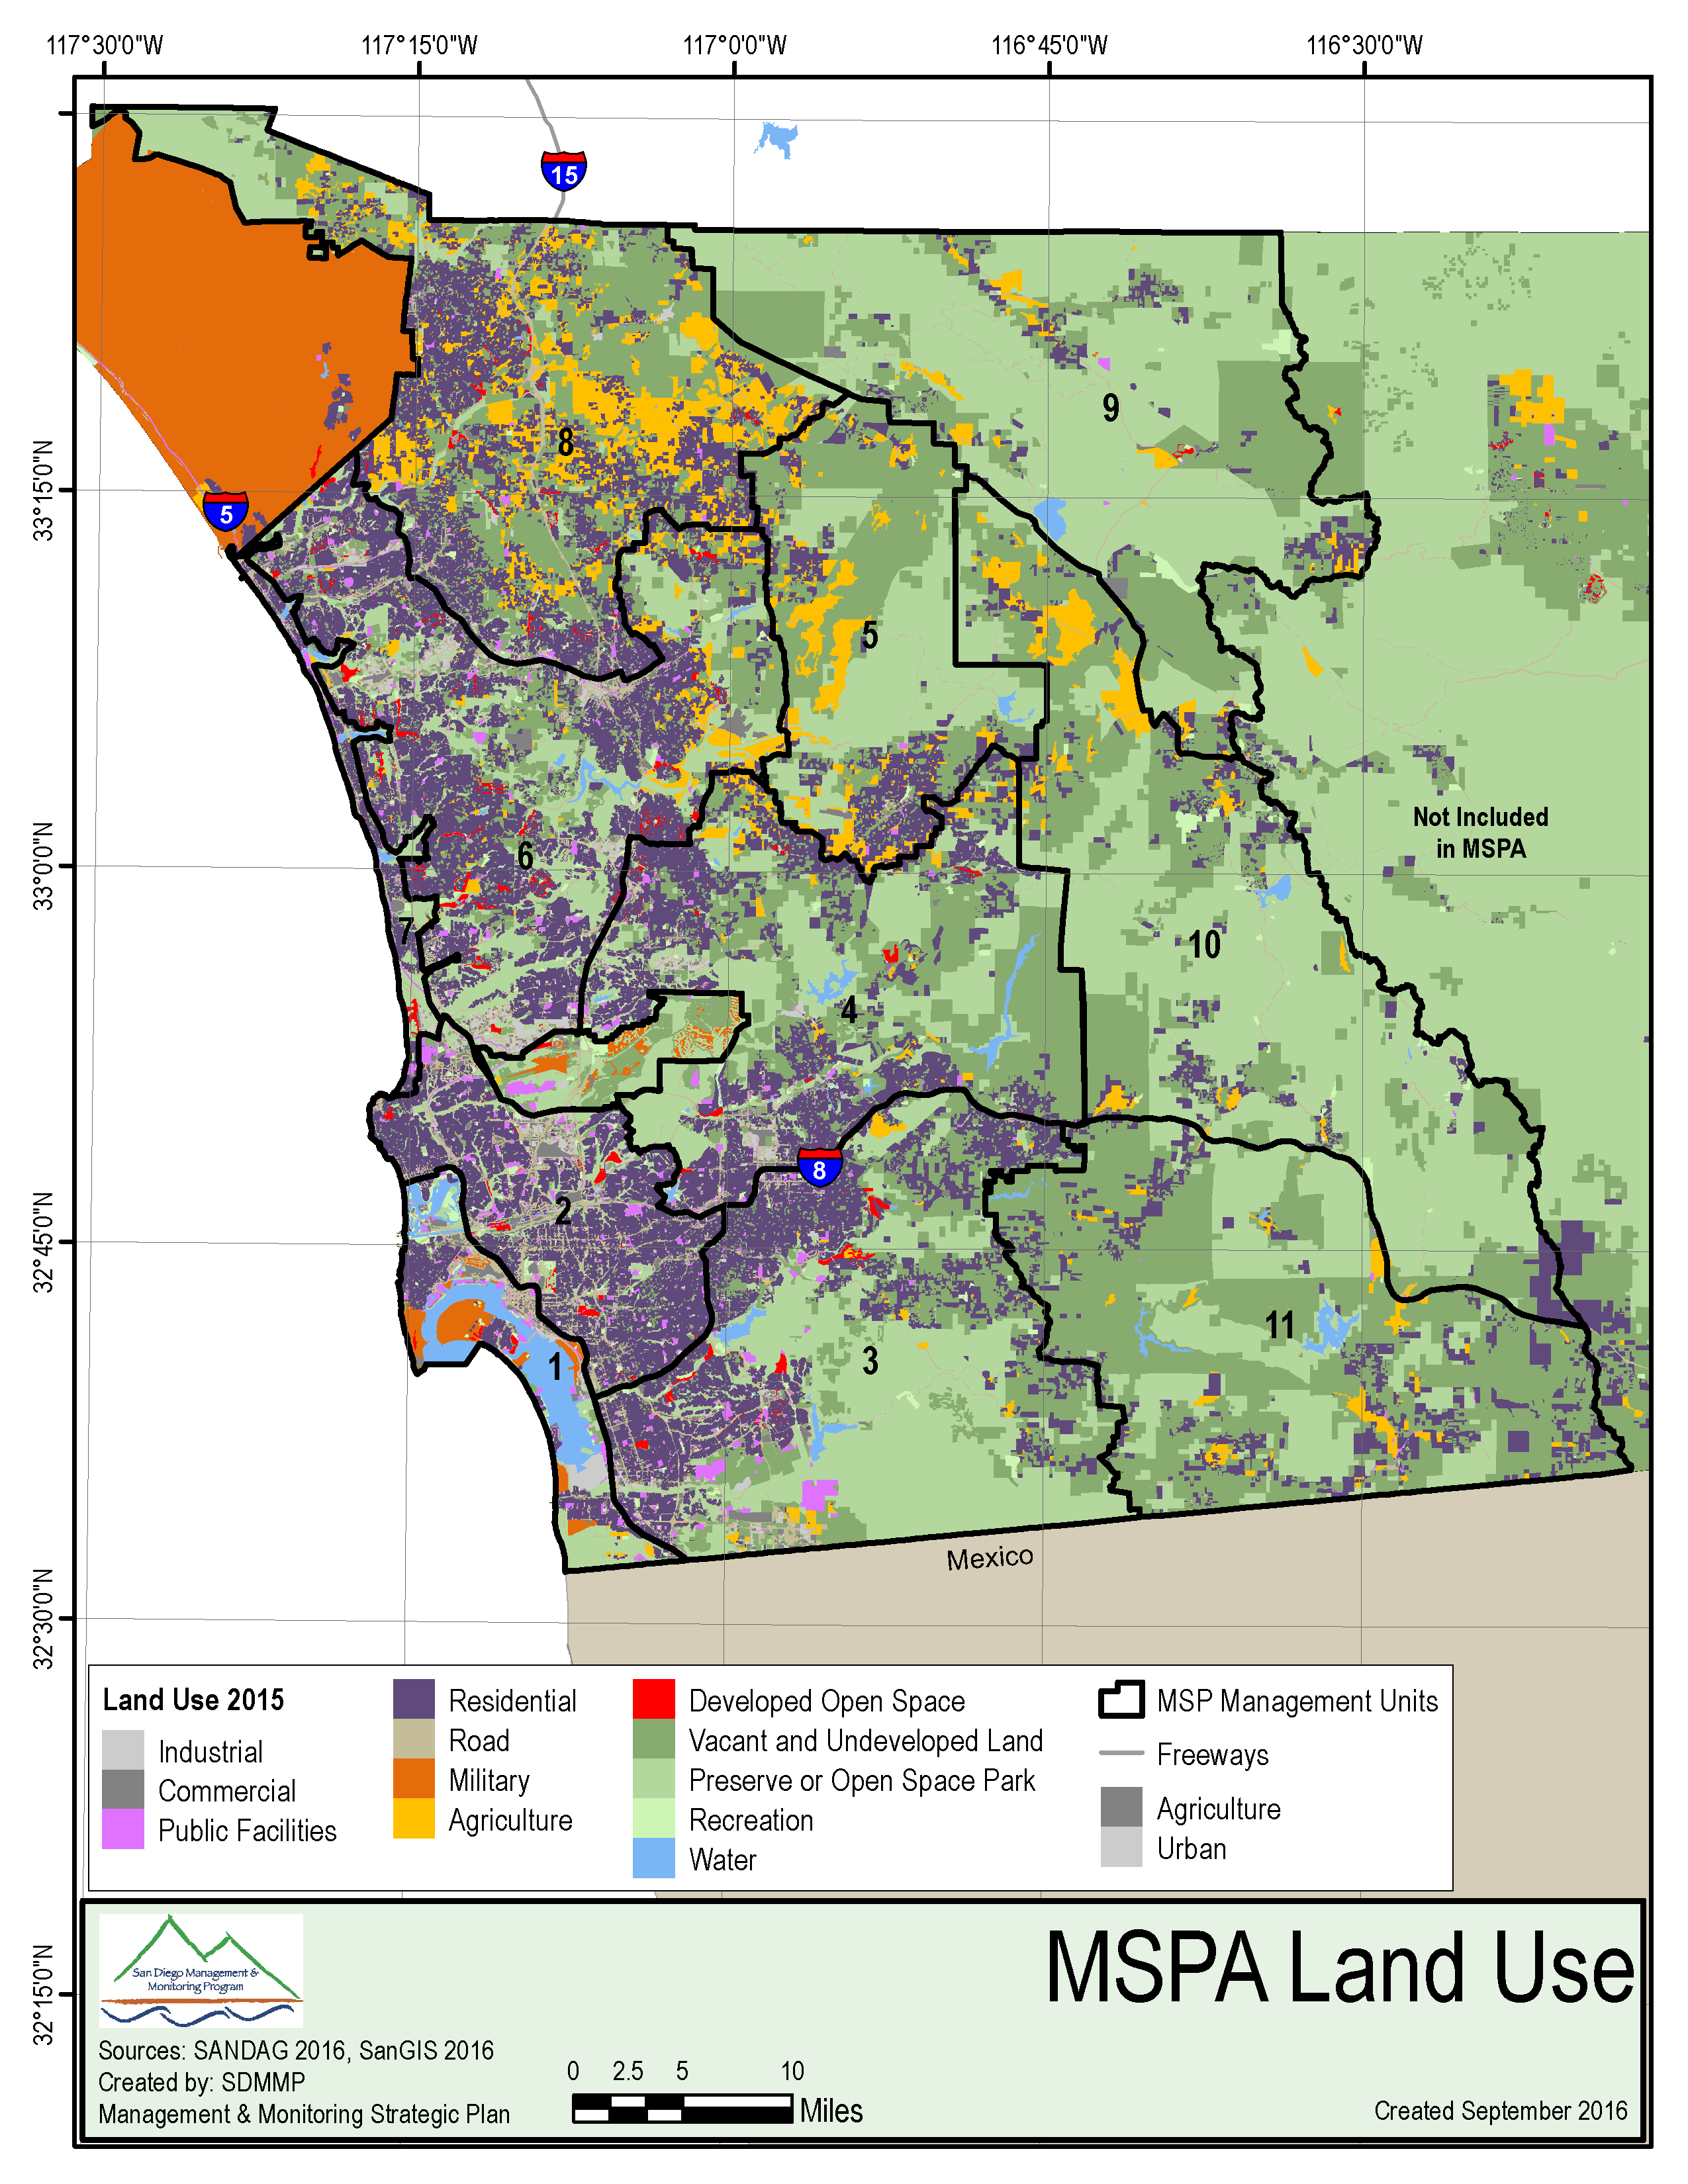
Figure V1.3-1: Land Uses in the MSPA.
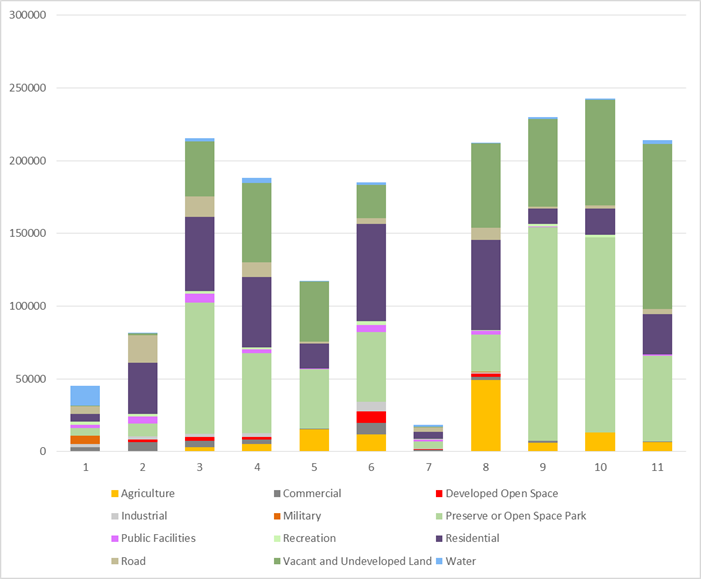
Figure V1.3-2: Land Use by percentage in each MU.
Large patches of vacant and undeveloped land extend to the east. Vacant and undeveloped lands are privately owned and will be the opportunity areas for future reserve assembly. Preserve or Open Space Park lands are considered conserved and is where management and monitoring activities will be focused. Military lands are not addressed in the MSP, but some essential populations of MSPA species or habitats occur on military lands and depend on ongoing management.
Table V1.3-2. Description of land uses within the MSPA.
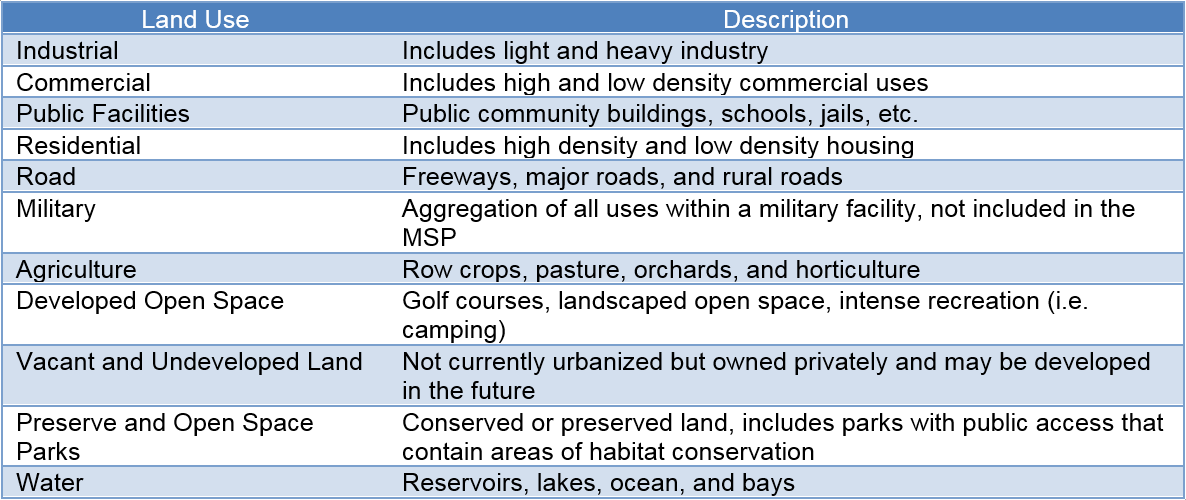
Currently, there are approximately 628,648 acres of Conserved Lands within the MSPA, owned by local governments, state and federal agencies, nonprofit organizations, homeowner associations, corporations, and private individuals (Table V1.3-3). The largest land holders include the California Department of Parks and Recreation (CDPR), the U.S. Forest Service (USFS), the City of San Diego, the Bureau of Land Management (BLM), CDFW, San Diego County, and USFWS (Figure V1.3-3).
Table V1.3-3. Land owners with more than 3,000 acres of Conserved Lands within San Diego County.
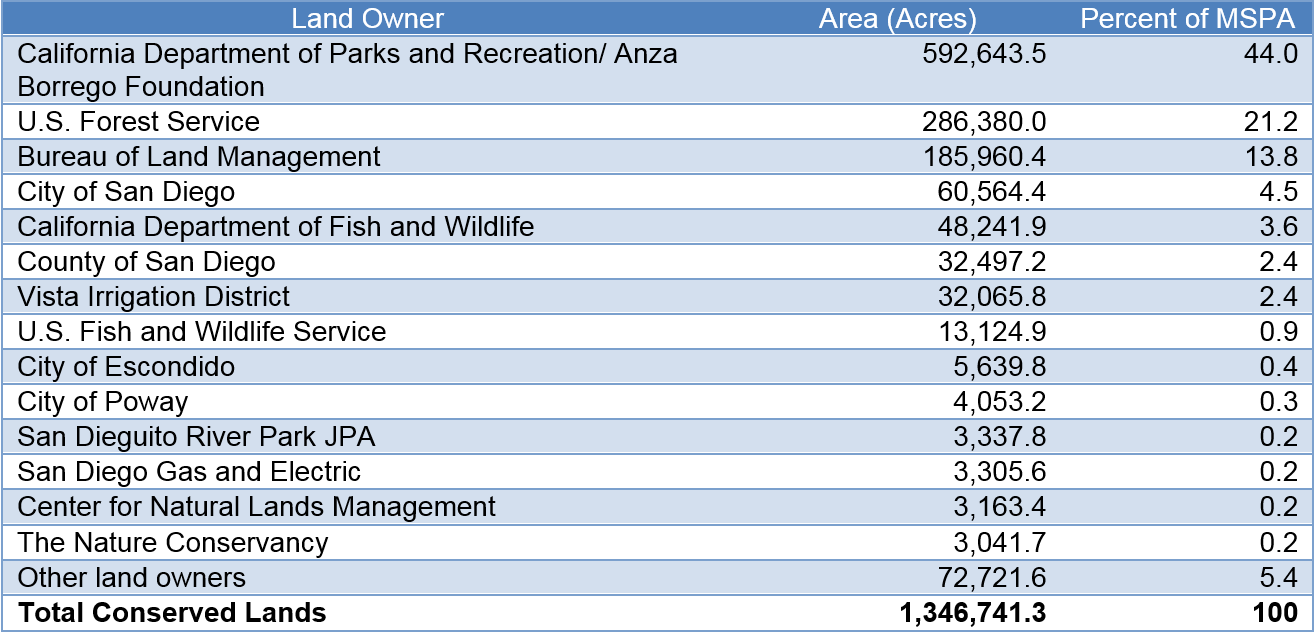
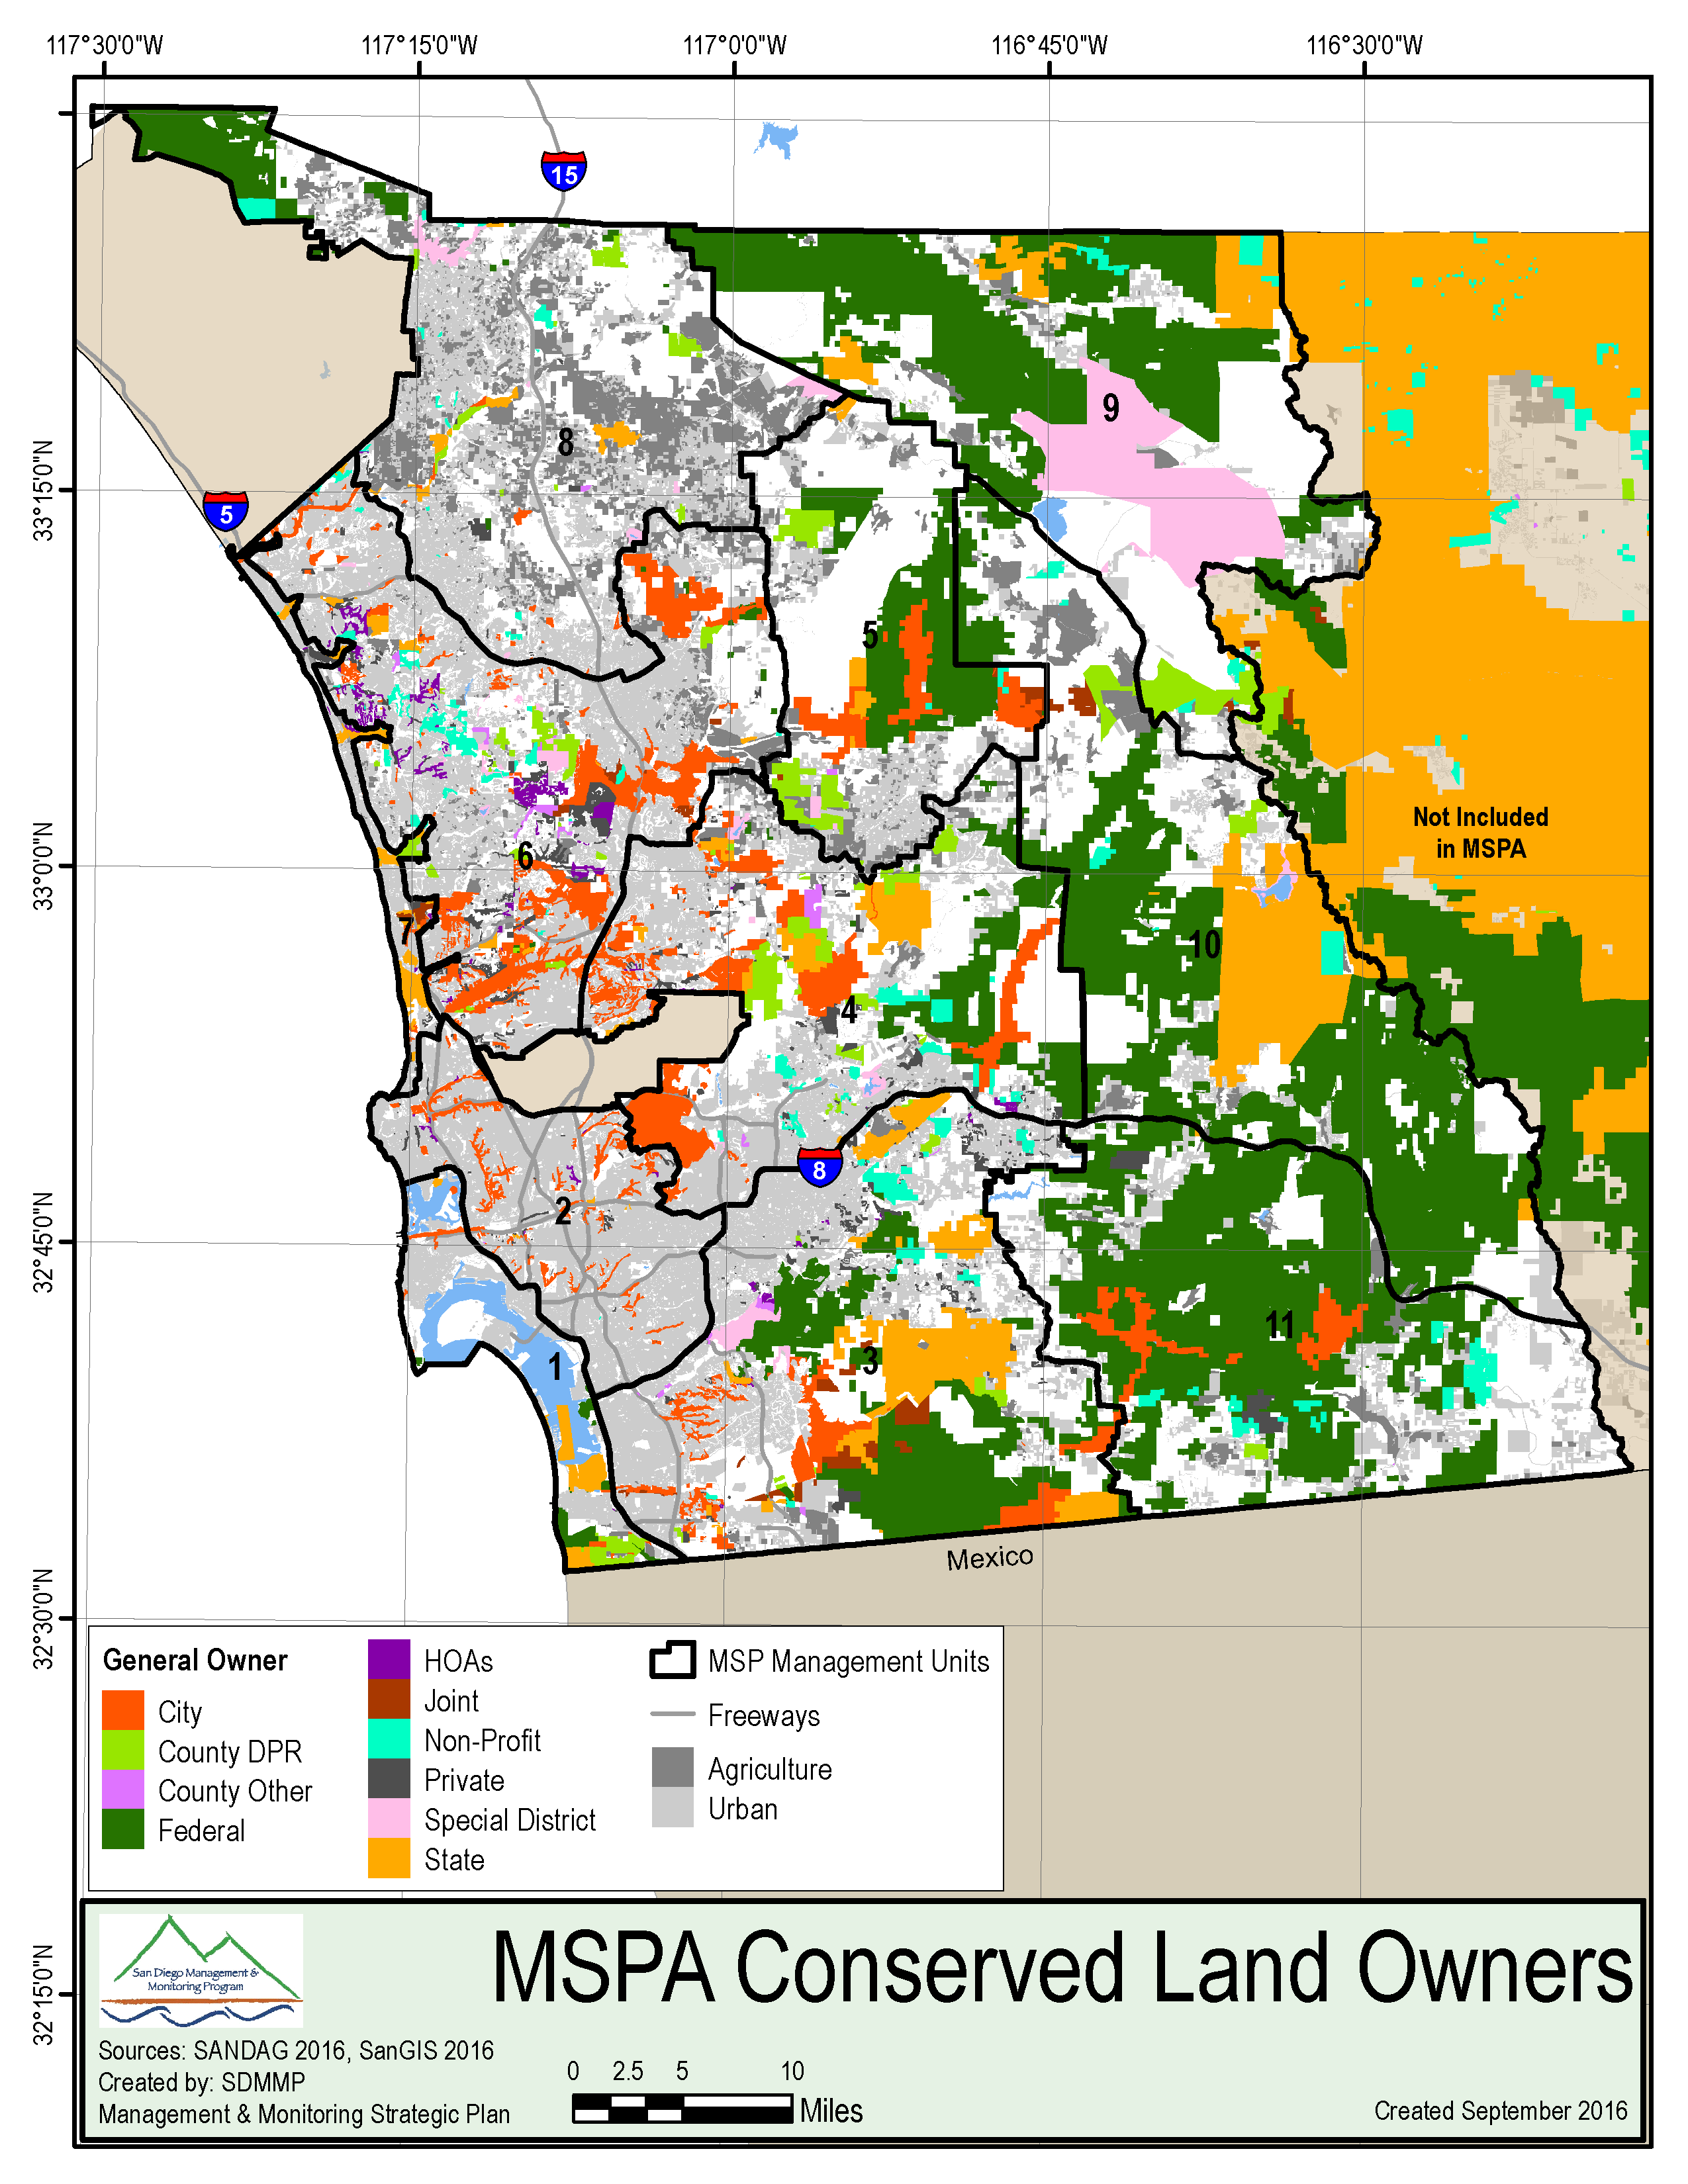
Figure V1.3-3: Conserved lands by ownership in the MSPA.
The CDPR owns and operates Anza Borrego State Park, the largest preserve in the MSPA. Anza Borrego is primarily in MUs 9, 10, and 11. The CDPR owns other land holdings, which include Border Field State Park, Silver Strand State Beach, Torrey Pines State Natural Reserve, other beaches along the coast, and the San Pasqual Battlefield State Historic Park.
The USFS manages the Cleveland National Forest (CNF) with lands in MUs 3, 4, 5, 8, 9, 10, and 11. The CNF was created in 1908 and, in total, covers 286,380 acres in the MSPA (Sakarias 1975), most of which is in the eastern and northern portions of the MSPA. Originally, the purpose of the CNF was to protect water resources and the majority of land is positioned upstream of the local reservoirs (Sakarias 1975). The CNF’s large tracts of undisturbed land provide habitat for many MSPA plant and animal species populations.
Land owned by the City of San Diego is primarily managed by either the City Parks and Recreation Department or the Public Utilities Department. Both departments actively manage covered species and vegetation communities. The City owns land in all MUs except MUs 8, 9, 10, and 11.
The BLM owns and manages land in MUs 3, 4, 5, 6, 8, 9, 10, and 11. Some land owned by BLM is managed by the County of San Diego Department of Parks and Recreation. The largest contiguous BLM holding is Otay Mountain, which occurs south of Jamul and along the U.S.-Mexico border. While hiking and camping are permitted, motorized vehicles are excluded from the wilderness area (BLM 2012). Areas within and adjacent to the wilderness areas may be heavily impacted by Border Patrol activities and trails or encampments created by migrants.
CDFW manages its state-owned land to maintain "native fish, wildlife, plant species, and natural communities for their intrinsic and ecological value and their benefits to people" (CDFW 2016). The CDFW lands are generally designated as either a Wildlife Area or an Ecological Reserve, although some lands are undesignated. CDFW manages land in all the MUs, except MU1 and 11. Some preserves owned by CDFW are managed by other organizations, including the Center for Natural Lands Management (CNLM), County of San Diego, and the Endangered Habitats Conservancy. CDFW also holds approximately 40 conservation easements within the MSPA.
The County of San Diego owns preserves spanning all MUs. Preserve land is managed by the County Department of Parks and Recreation. County preserves provide a variety of habitats including coastal estuaries, riparian forests, coastal sage scrub, chaparral, and oak woodlands. These all support a diverse array of plant and animal species.
Vista Irrigation District is not a cosigner on the MSCP or MHCP but they manage natural resources on over 32,000 acres independently from the MSP.
USFWS owns land mainly in the southern part of the county. These lands are part of the San Diego National Wildlife Refuge (NWR) and San Diego Bay NWR. The San Diego Bay NWR includes discontiguous parcels on the San Diego Bay. Inland; the San Diego NWR includes lands generally between the Sweetwater and Otay Reservoirs.
The California State Department of Transportation (Caltrans); Sweetwater Authority; the cities of Chula Vista, Escondido, Carlsbad, Poway, and Oceanside; and the San Diego River Conservancy all own Conserved Lands within the MSPA. A number of nonprofit organizations also own or hold easements on Conserved Lands including the CNLM, Fallbrook Land Conservancy, The Nature Conservancy (TNC), San Dieguito River Valley Land Conservancy (SDRVC), San Elijo Lagoon Conservancy, and the Endangered Habitats Conservancy (EHC).
The MSPA includes vegetation communities from the coastal beaches to the peaks of the Laguna Mountains (Figure V1.3-4). There were 11 general categories of vegetation (Table V1.3-4) mapped (coastal bluff dunes not shown on map due to a lack of reliable information). In 2012, AECOM mapped 661,850.9 acres of land within the MSPA (AECOM 2014); the results are included on maps of the MSPA. Areas not covered by AECOM in 2012 were mapped using the CalVeg vegetation information, updated as recently as 2015 (for more information on methods, see Vol. 1. Sec. 2.6.2). Urban, agricultural, and water land uses were excluded from vegetation calculations.
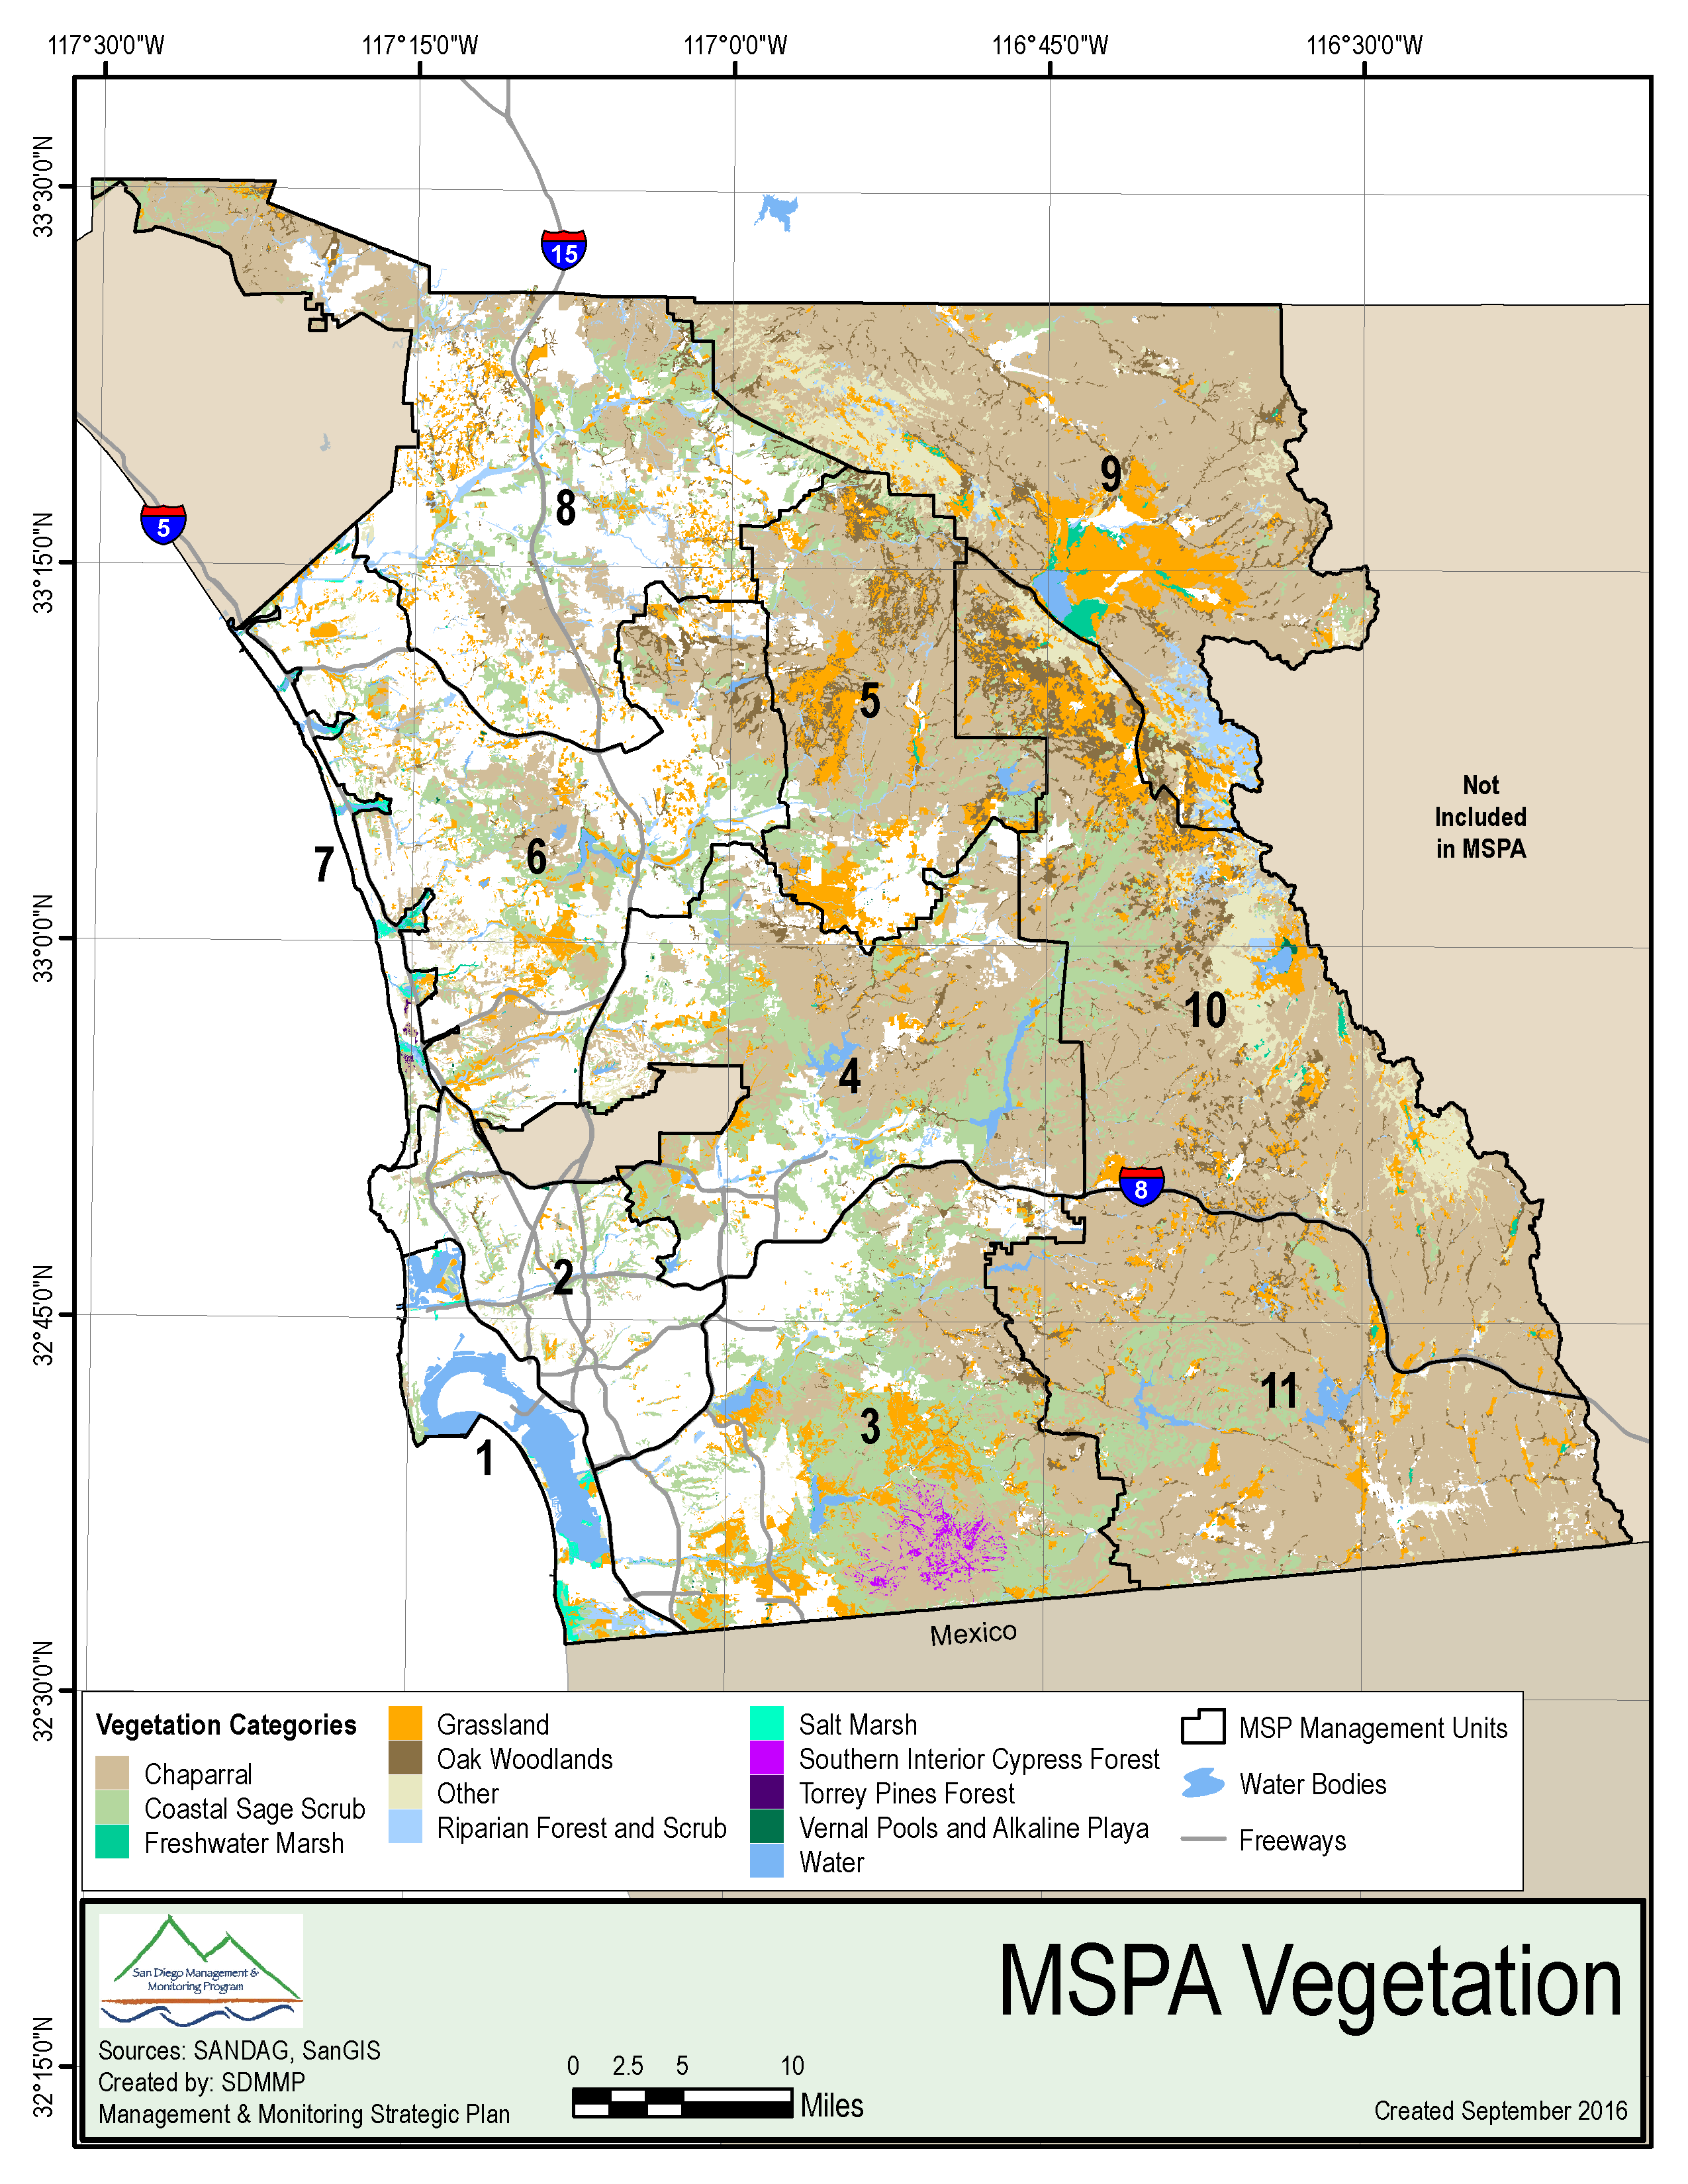
Figure V1.3-4: Map of vegetation communities in the MSPA.
Table V1.3-4: Vegetation community crosswalk for AECOM 2012 mapping, CalVeg mapping, and other sources to MSP Categories.
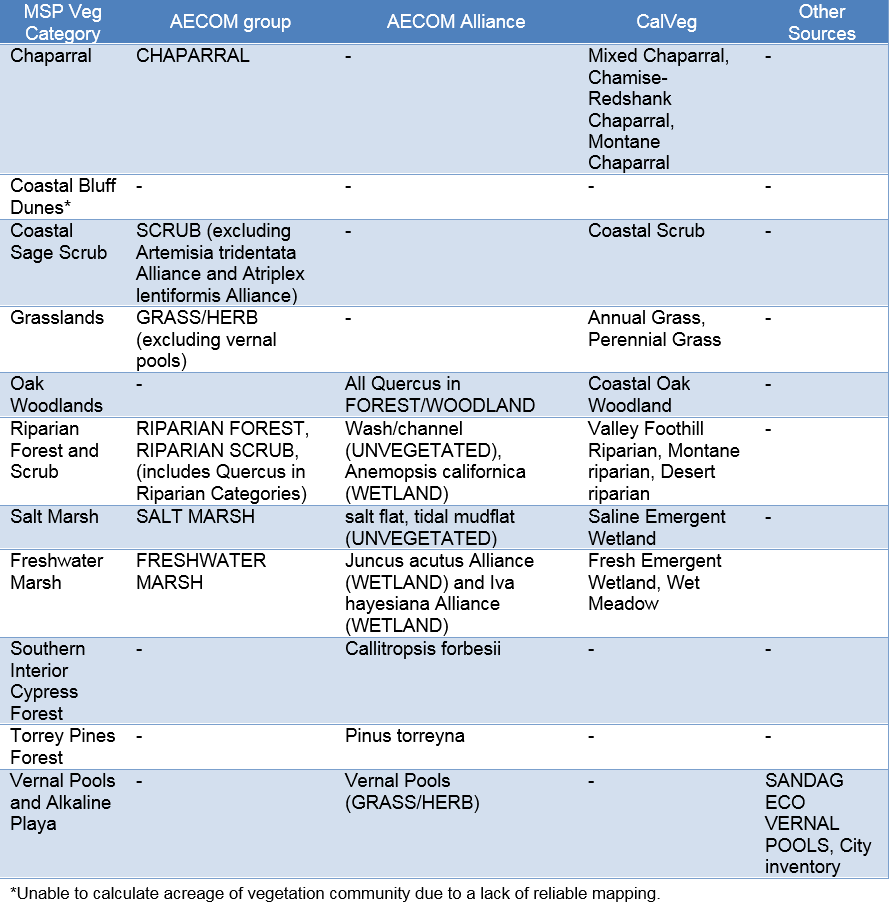
*Unable to calculate acreage of vegetation community due to a lack of reliable mapping.
On undeveloped land in the MSPA, shrublands compose 52.7% of the area and include chaparral (40.2%) and coastal sage scrub (12.5%) (Figure V1.3-5). MU11 has the most chaparral, with over 160,000 acres. Over 57% of the chaparral in the MSPA is conserved (406,000 acres) while 48% of coastal sage scrub is conserved. MUs with the most conserved chaparral include MUs 4, 9, 10, and 11 (Figure V1.3 6). MUs with the most conserved coastal sage scrub include MUs 3, 4, and 11.
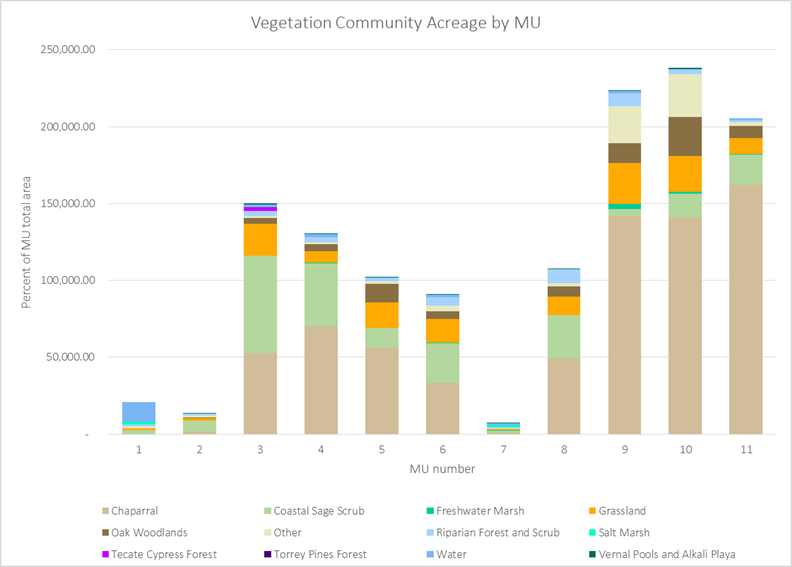
Figure V1.3-5: Acreages of each vegetation community on undeveloped land in each MU. Acreages include un-conserved lands.
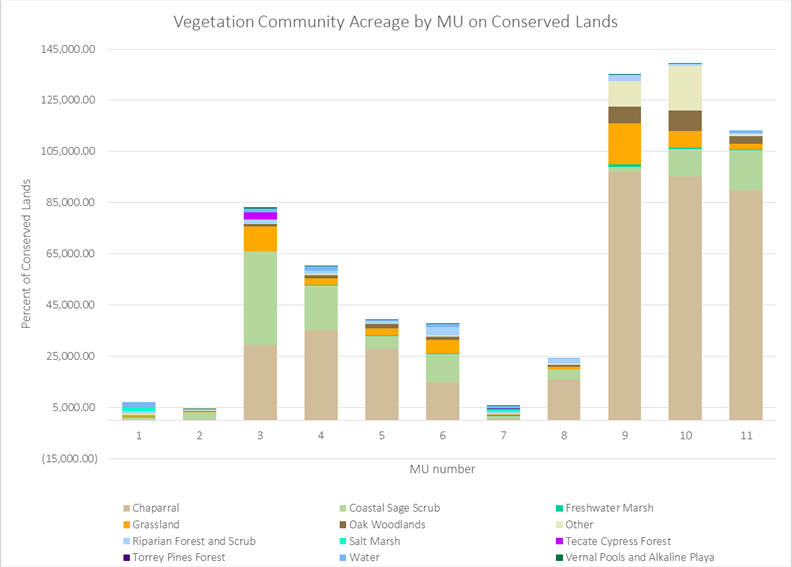
Figure V1.3-6: Acreages of each vegetation community on Conserved Lands by MU. Values do not include urban or agriculture.
Oak woodlands make up 4.4% of the MSPA. MUs with the most oak woodlands include MUs 5, 9, and 10. Just over 30% of the oak woodlands are on Conserved Lands. MUs 9 and 10 contain the most conserved woodland area. Grasslands cover a total of 7.7% of the MSPA. MUs 3, 9, and 10 have the most grassland. Just over 35% of the grassland is conserved.
Water-dominated vegetation types include riparian forest and scrub, salt marsh, freshwater marsh, and vernal pools and alkaline playa. Together, these vegetation communities make up 2.7% of the MSPA and 3.1% of the Conserved Lands. Salt marshes are concentrated along the coastal lagoons. A large area of freshwater marsh is present in MU9, in the basin containing Lake Henshaw.
Overall, 11,000 patches of contiguous vegetation are present in the MSPA (Figure V1.3-7). The area is heavily bisected by major freeways, including Interstates 8, 5, 805, and 15. Smaller highways with heavy traffic also bisect a number of undeveloped areas. The average patch size in the MSPA is 116 acres, but the distribution is heavily skewed by a large number of small patches in urban areas and only a few larger patches in the eastern portion of the MSPA (Table V1.3-5).
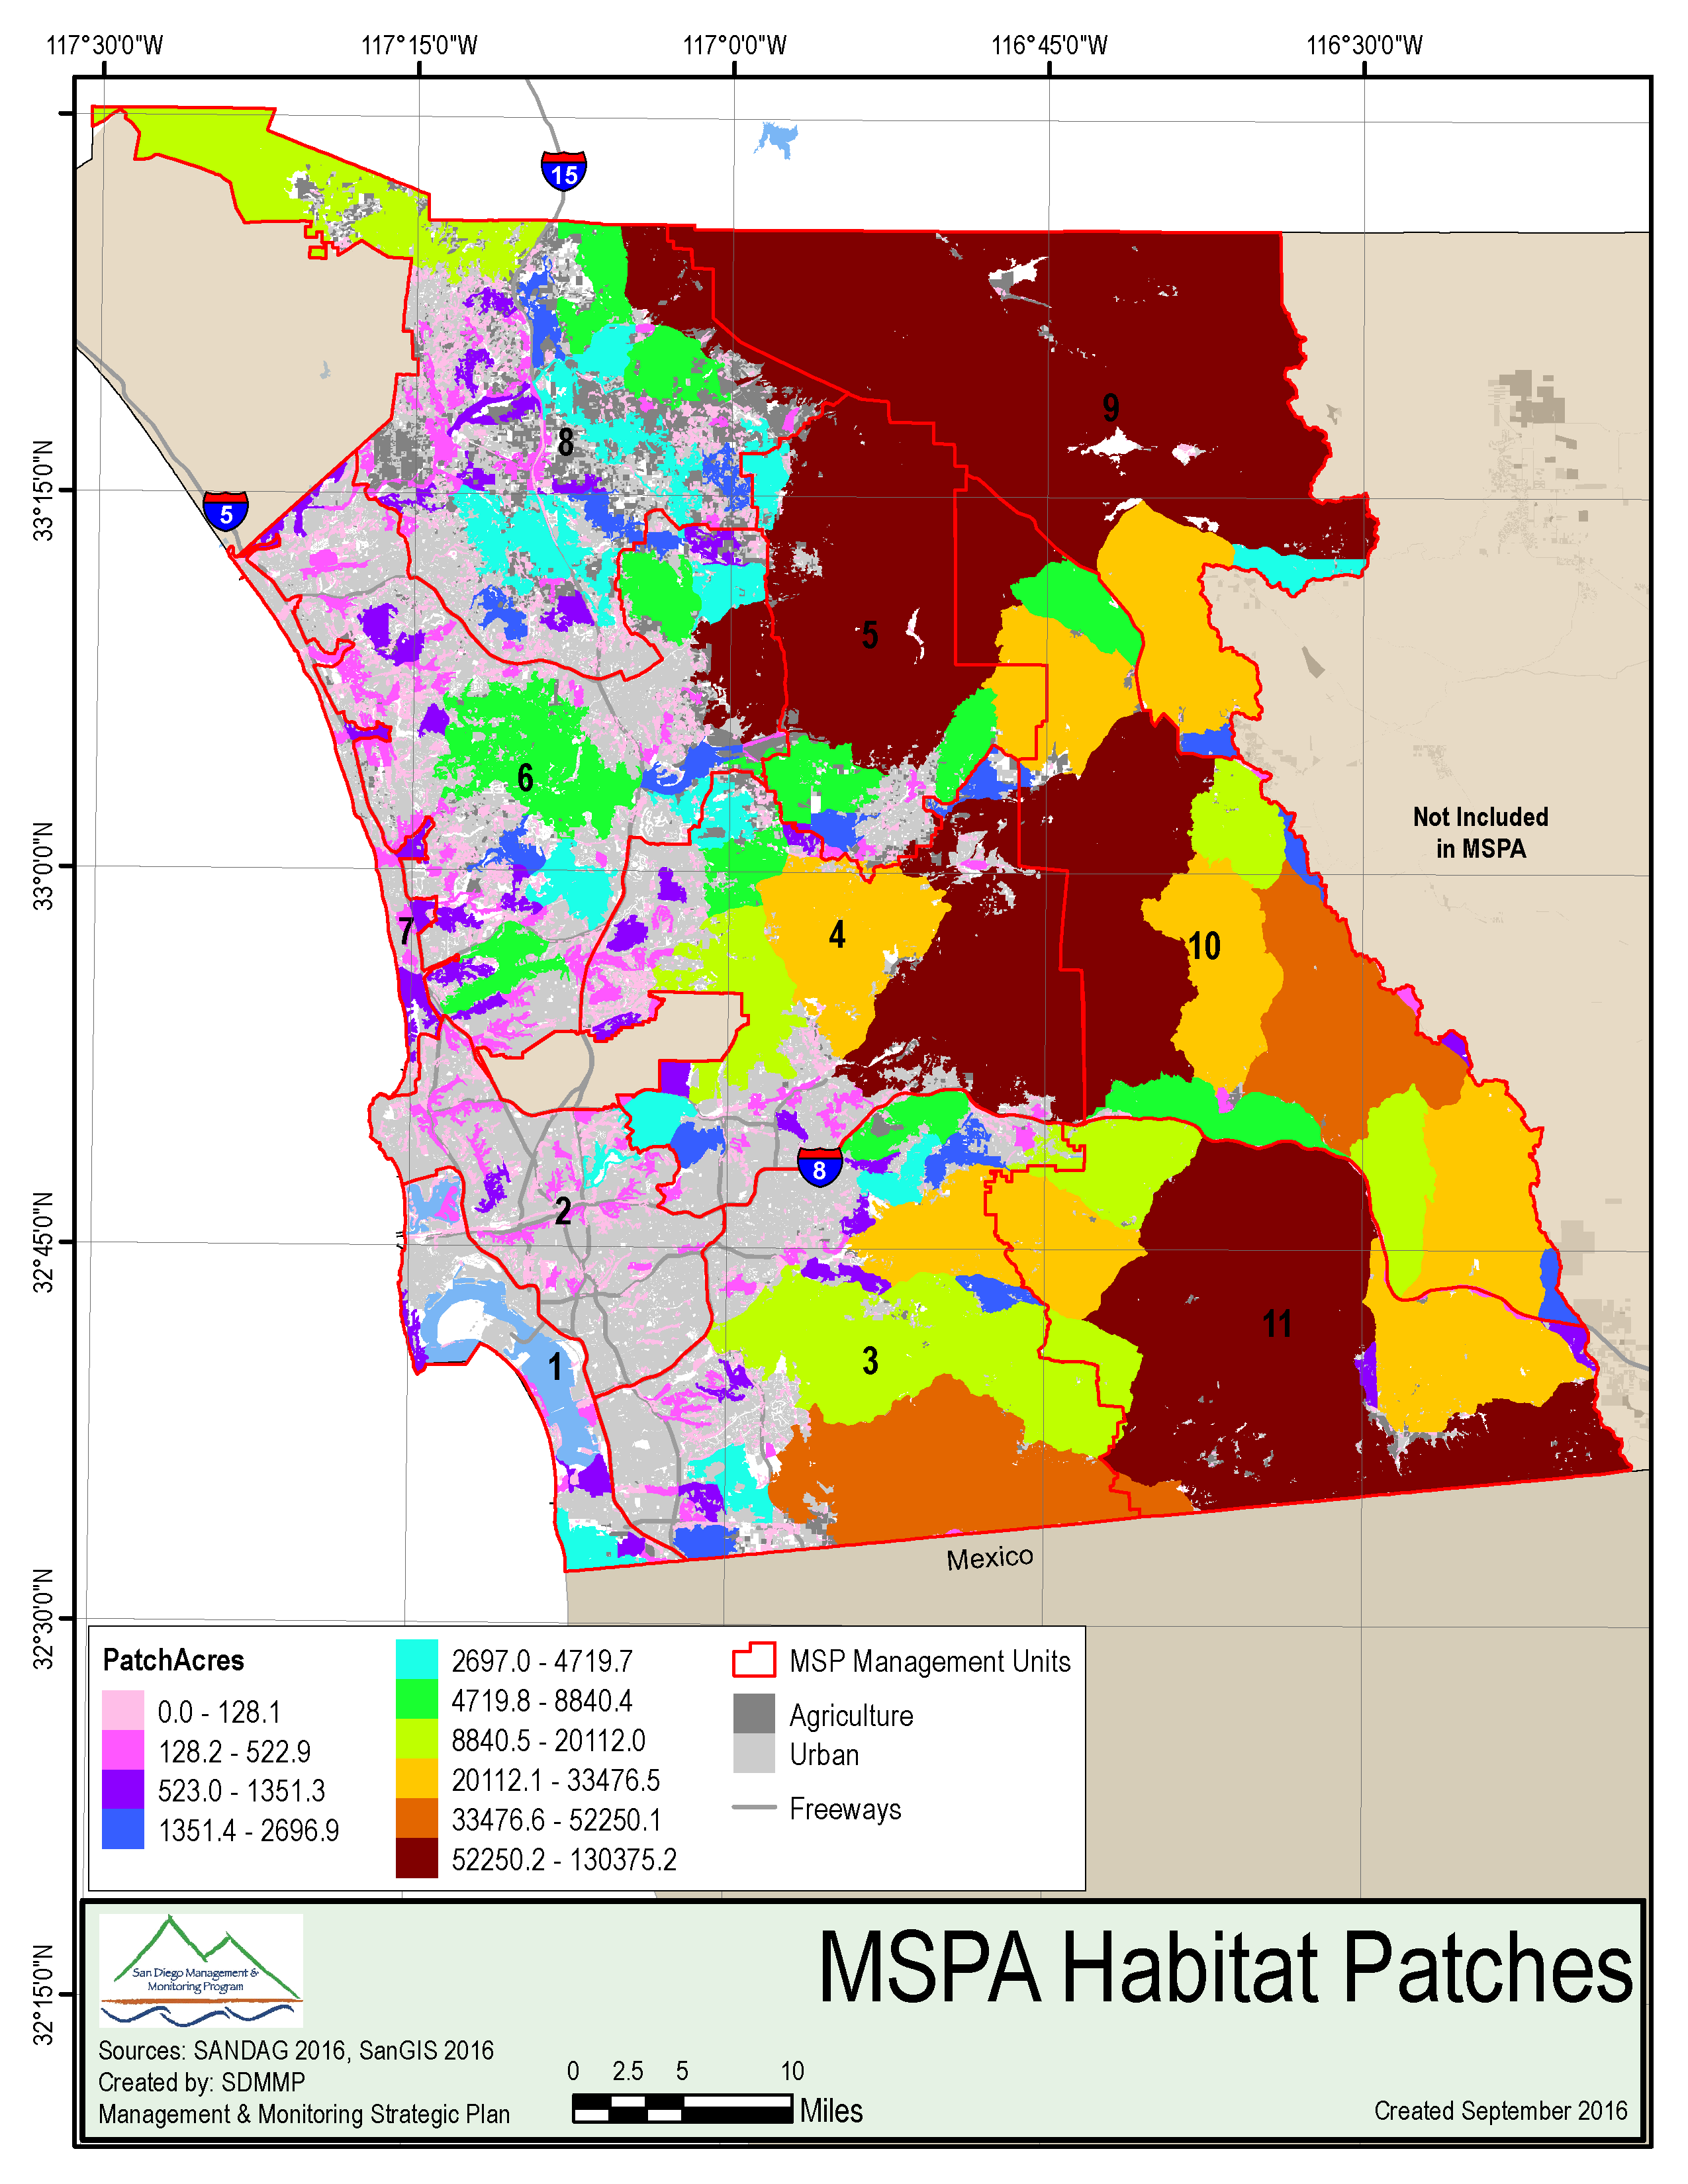
Figure V1.3-7: Contiguous patches of potential habitat in the MSPA.
Table V1.3-5: Patch size summary for MSPA.
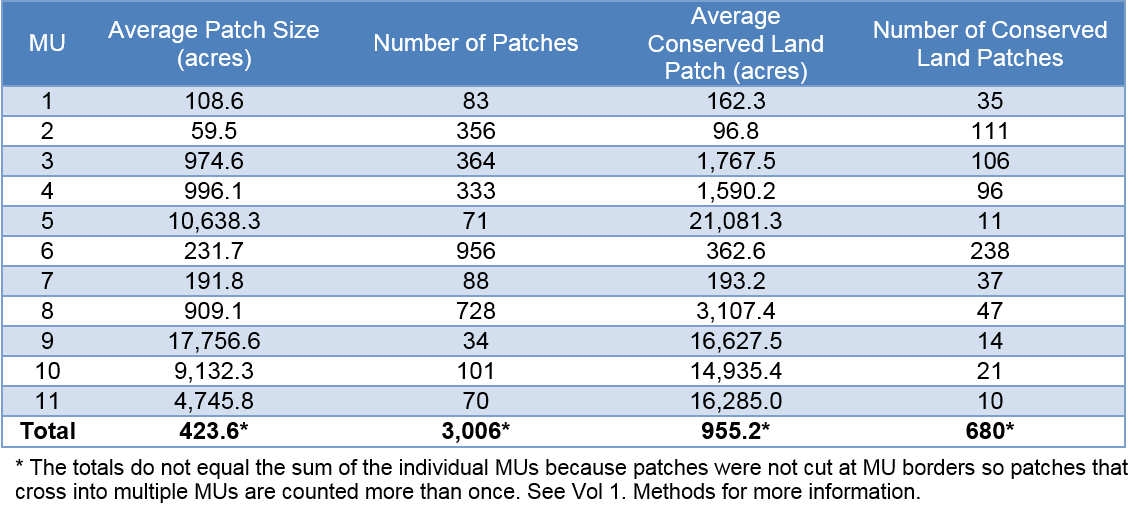
*The totals do not equal the sum of the individual MUs because patches were not cut at MU borders so patches that cross into multiple MUs are counted more than once. See Vol 1. Methods for more information.
Patches of Conserved Lands represent contiguous habitat that is currently protected from future development. These patches do not include conserved areas that were mapped as agriculture, urban, or water (see Vol. 1, Sec. 2.6.2 for more information). In most cases, the average patch size of conserved habitat is larger than the average general patch size. This is because the general patch calculations include many very small, isolated pieces of land that do not provide valuable resources or are not accessible to covered species. Land acquisition efforts are focused on creating larger areas of contiguous habitat or connecting patches together.
The MSPA contains 14 major river drainage basins (Figure V1.3-8). Streams collect runoff from rain and snow melt in the Laguna Mountains and flow west into the Pacific Ocean. Dams along all the major streams alter the natural flow and nutrient cycles. Lagoons along the coast collect the accumulated water, sediment, and nutrients and discharge into the ocean.
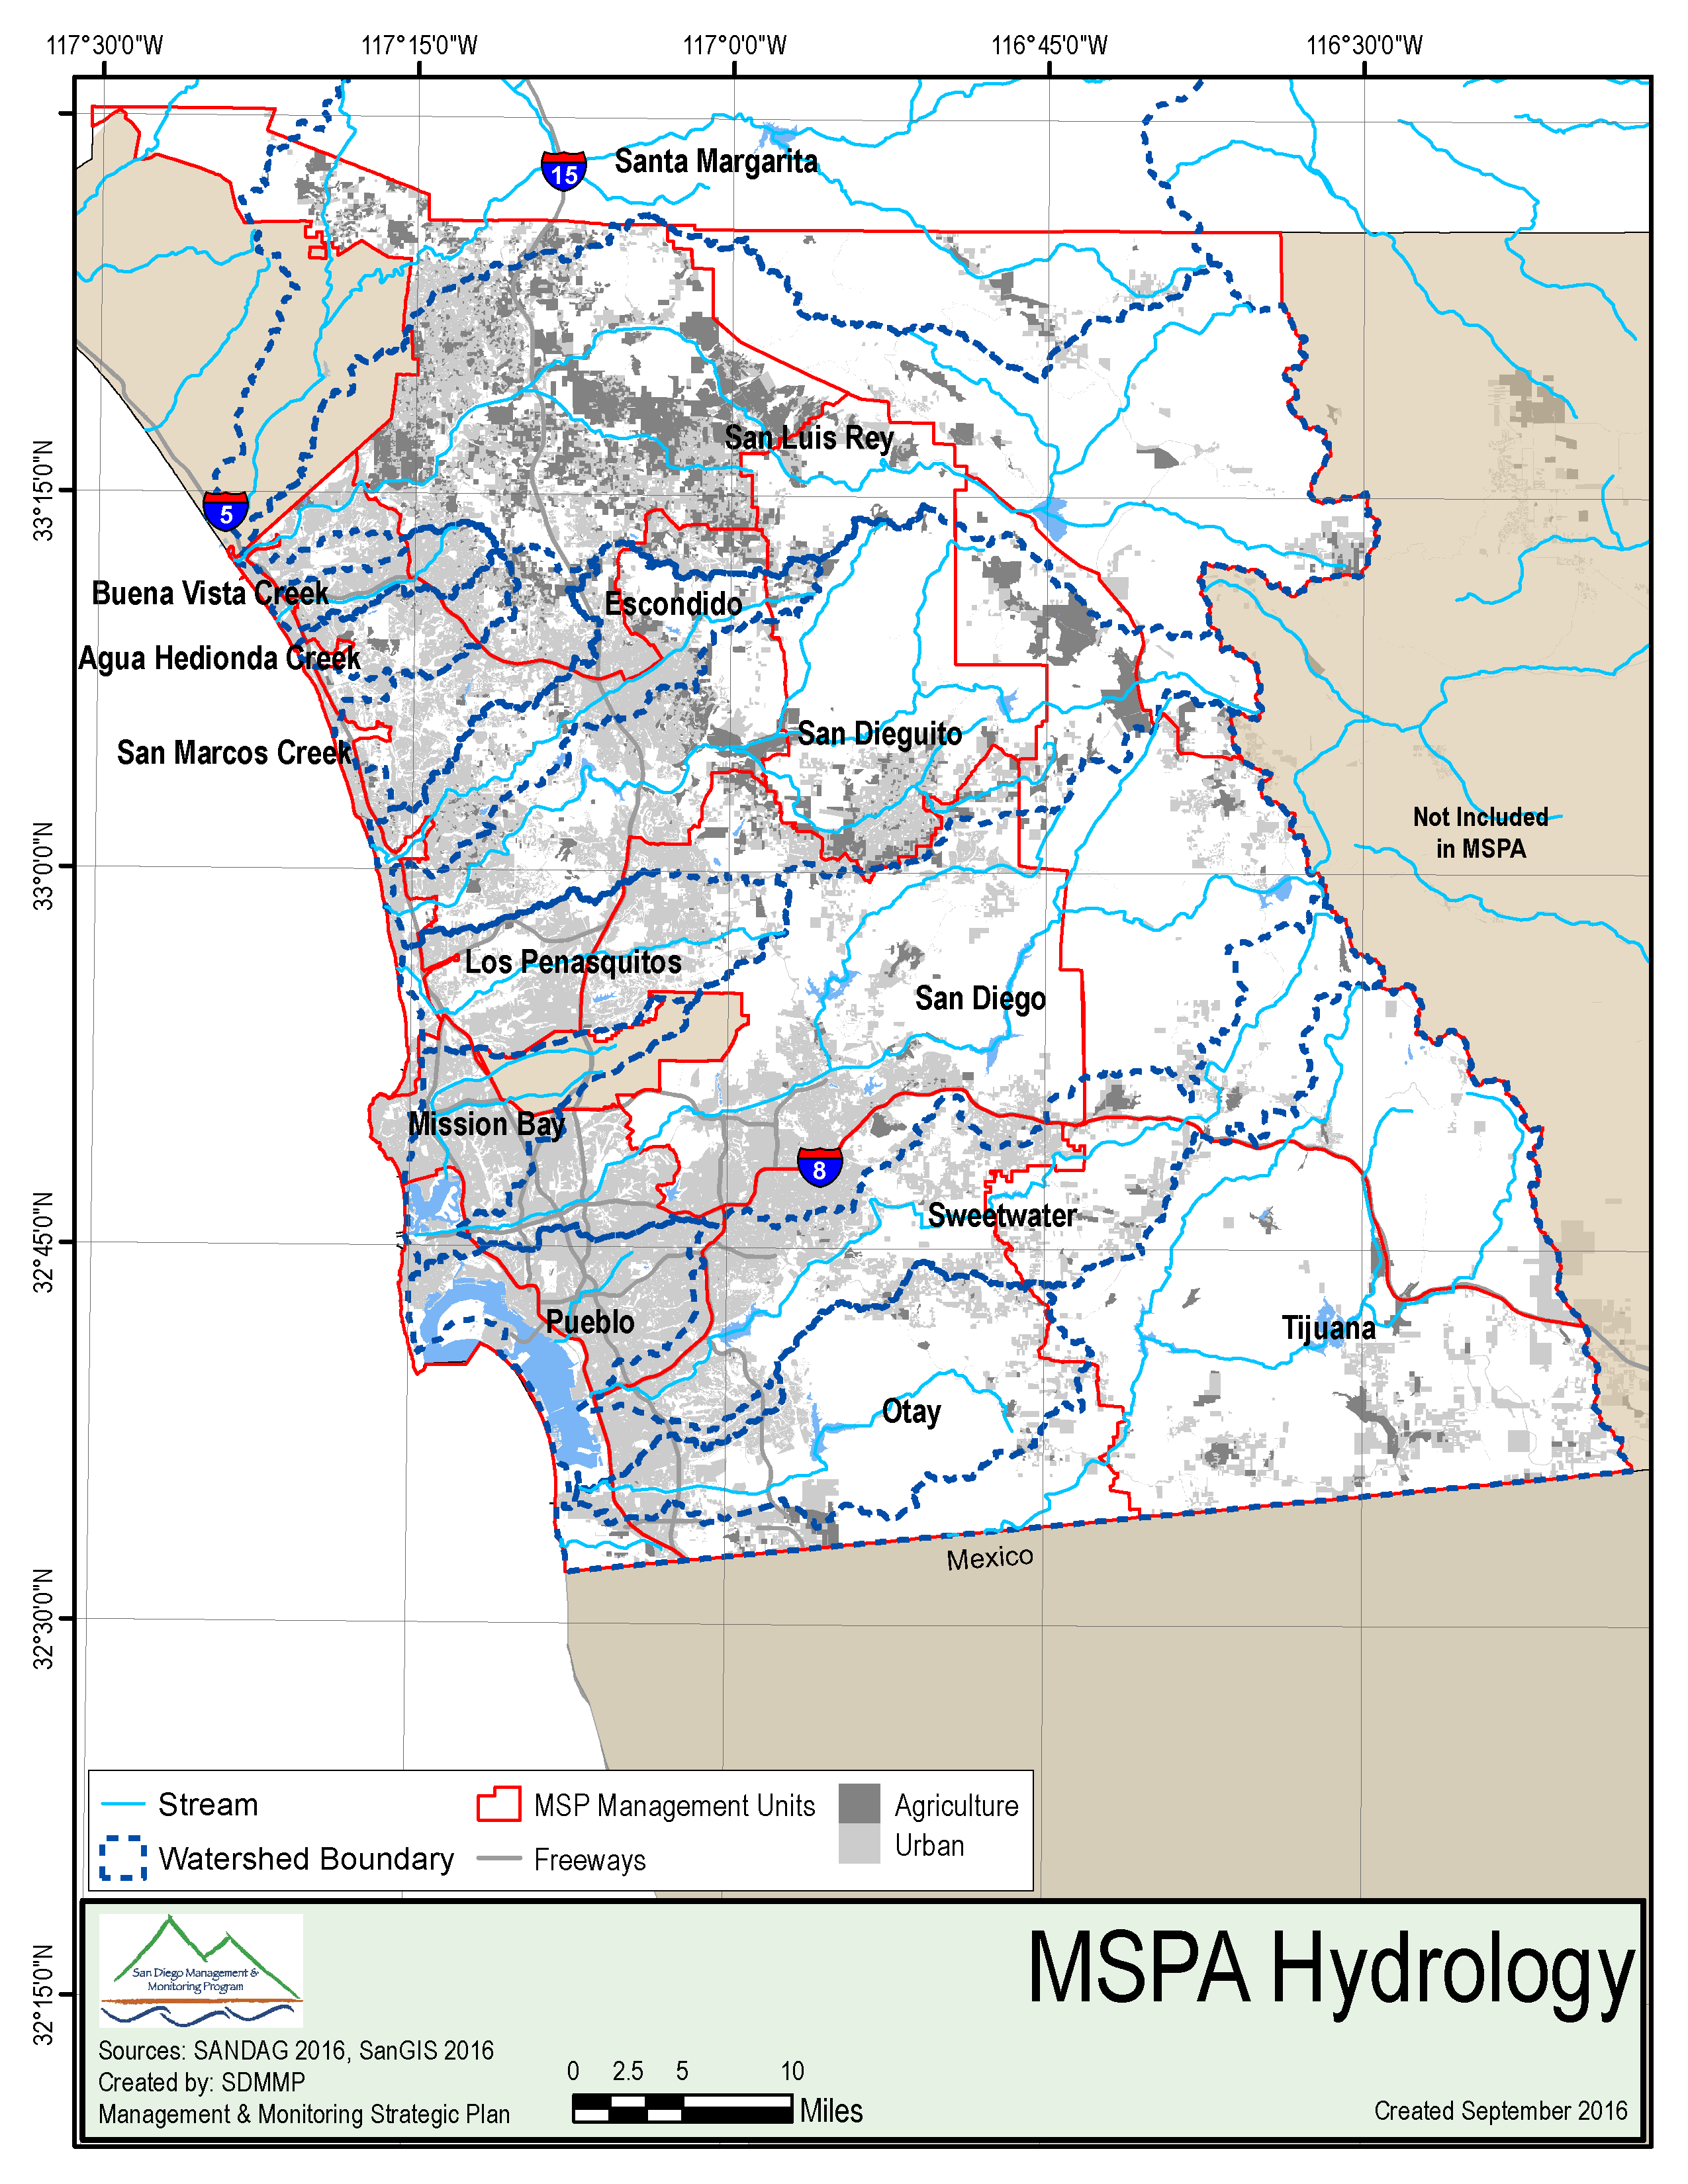
Figure V1.3-8: Major river drainage basins in the MSPA.
A number of covered species depend on stream flow quantity and quality for habitat. Alterations to the natural hydrology include dams, channelization, and flow and geomorphological alterations. For more information about threats/stressors concerning hydrologic conditions, see Vol. 2, Sec. 2.3.
Throughout the recorded fire history (up to July 2016), a total of 1,184,509.2 acres have burned in the MSPA at least once (Figure V1.3-9). A total of 684,247.7 acres have burned more than once since 1878. About 920 acres have burned 8 or more times. Fires tend to burn more frequently in the eastern part of the MSPA where there is dispersed urban development. However, notable large fires in 2003 (Cedar Fire) and 2007 (Witch Fire) burned up to 5 miles away from the coast.
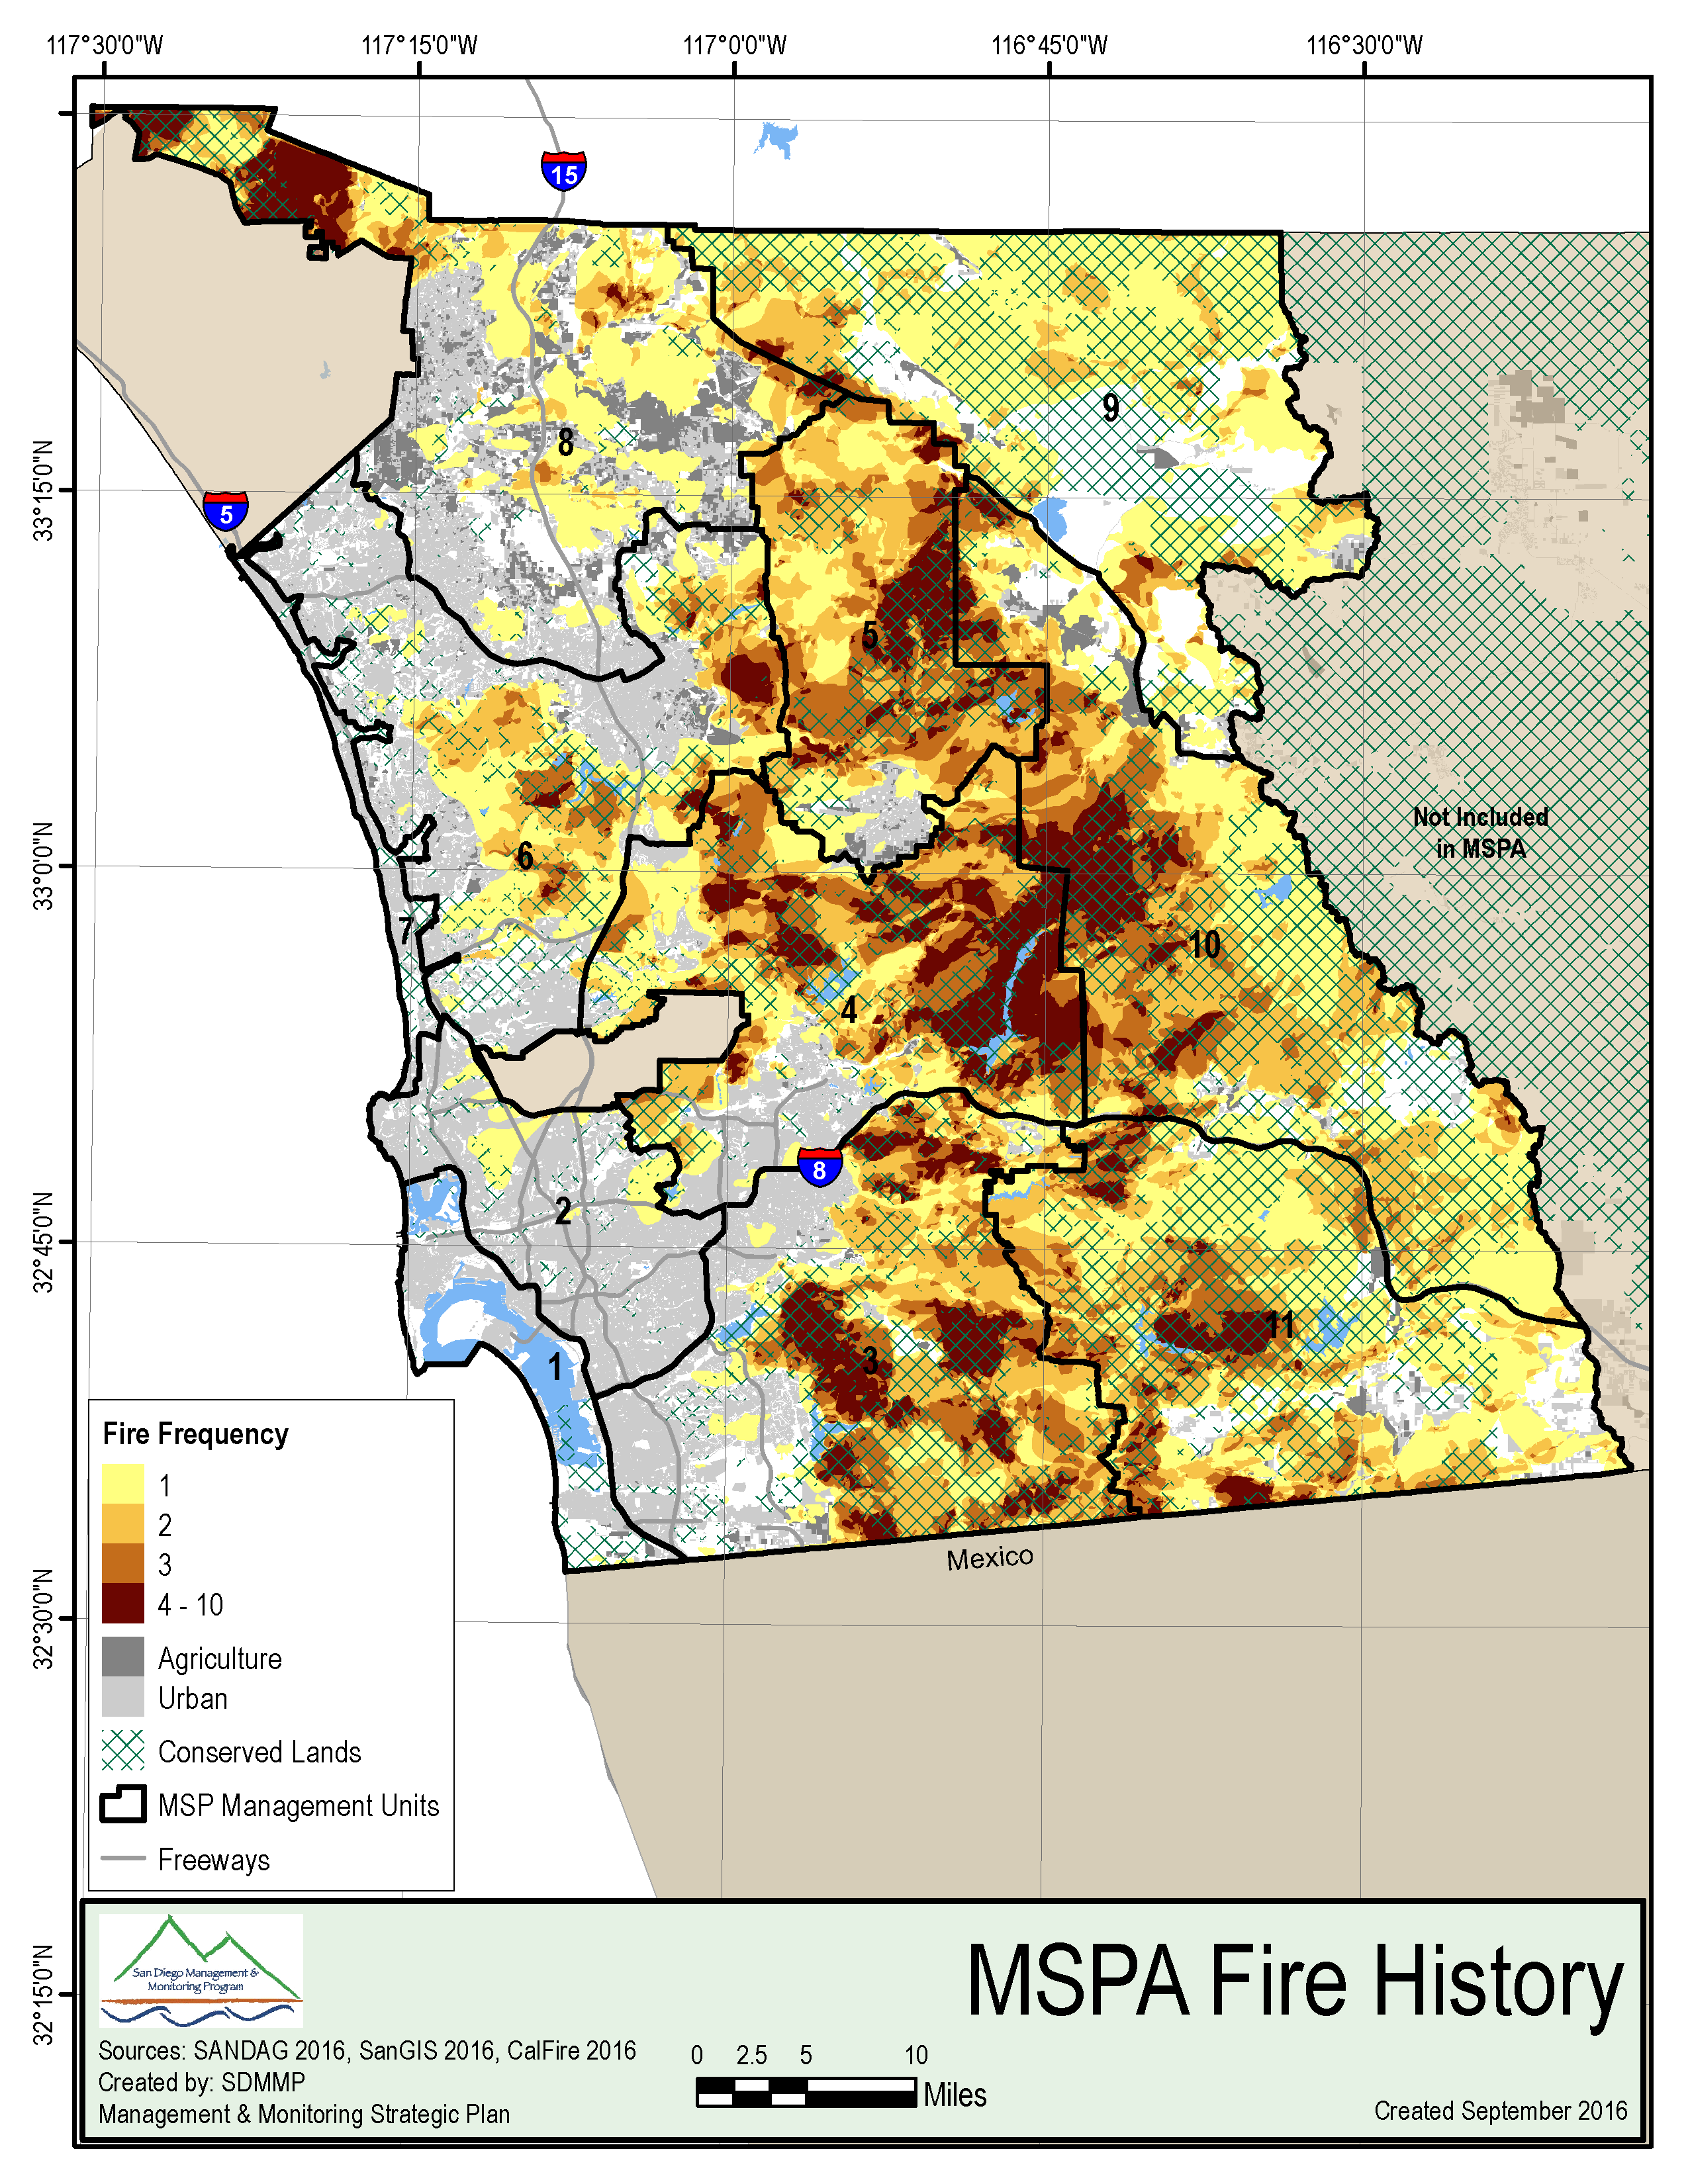
Figure V1.3-9: Number of fires burned since 1878 in the MSPA.
Figure V1.3-10 identifies the percent of each MU that has burned 1, 2, 3, or 4 or more times since 1878. By percent, MUs 1 and 7 have burned the least at 0.7% and 0.4%, respectively. Overall, MUs 5, 10, and 11 have burned the most with 92%, 89%, and 82% burned at least once, respectively. MU4 has the highest number of acres burned 4 or more times, with over 22,000 acres (12% of MU) burning 4 times and over 10,000 acres (5.6% of MU) burning 5 or more times.
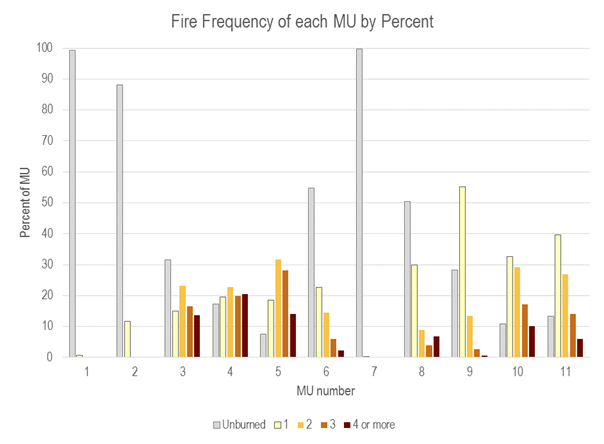
Figure V1.3-10: The fire frequency (number of fires) since 1878 by MU, expressed as a percent.
On Conserved Lands in the MSPA, a total of 562,918 acres (41% of all Conserved Lands) have burned in the recorded history. Conserved Lands have been disproportionately in the eastern MUs. Over 90% of Conserved Lands in MUs 4, 5, 10, and 11 have burned at least once. In MUs 4 and 5, over 25% of Conserved Lands have burned 4 or more times. Under 5% of Conserved Lands in MUs 1 and 7 have only burned once.
Section 3.2 includes information about the location, land use, Conserved Lands, vegetation and undeveloped patch size, hydrologic characteristics, and fire history of MU1. Use the online map to view map details for MU1. The map can be found at: https://sdmmp.maps.arcgis.com/apps/webappviewer/index.html?id=1921a2cc291f4570980dbc284dfe2e58
MU1 includes the southern coast of San Diego County. The MU is bordered to the south by Mexico, the west by the Pacific Ocean, the east by I-5, and the north by Pacific Beach. This MU includes Coronado, the Tijuana Estuary, Mission Bay, Point Loma, and downtown San Diego. Jurisdictions wholly or partially within MU1 include the Cities of Coronado, San Diego, Imperial Beach, Chula Vista, and National City.
The most prominent features in MU1 are San Diego and Mission Bays (31% of the total area) (see online map). Together, commercial, industrial, public facilities, and recreation make up 18.7% of MU1. Other predominate land uses include preserve or open space park (12.3%), residential (11%), roads (11%), and military (12%). Vacant and undeveloped land accounts for 1.1% or 527 acres (see online map).
Just over 7,200 acres of land are conserved in MU1 (12.3% of the total area). Two large reserve complexes within MU1 are the Tijuana Estuary and the San Diego Bay NWR. Smaller areas of Conserved Lands are located along the Silver Strand on the west side of San Diego Bay and in Mission Bay (see online map).
The largest preserve owners/managers that are partners in the implementation of the MSP include the USFWS, the County of San Diego Department of Parks and Recreation, the City of San Diego, the CDFW, and the CDPR (Table V1.3-6).
Table V1.3-6. Six largest preserves and owners/managers in MU1.
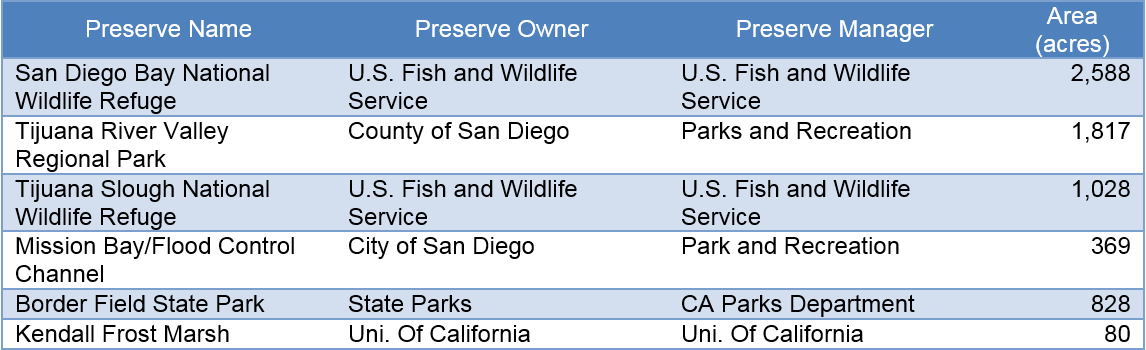
MU1 is highly urbanized with 51% of the area developed (75% if areas covered by water are excluded from the total area). On Conserved Lands in MU1, prominent natural vegetation types include salt marsh (17%), riparian forest and scrub (15%), and coastal sage scrub (16%) (see online map).
Table V1.3-7 displays the acres conserved by vegetation type and the percent of each vegetation type currently conserved within the MU. In MU1, the majority of riparian forest and scrub, salt marsh, and freshwater marsh are conserved.
Excluding San Diego Bay, MU1 contains 83 patches of contiguous habitat, averaging 108.6 acres (see online map). The largest patch is 3,373 acres and includes Tijuana Slough, Tijuana River Valley Regional Park, and Border Field State Park. Smaller patches include south San Diego Bay, Sweetwater Marsh, Point Loma Peninsula, and the San Diego River.
Table V1.3-7. Total acres and percent conservation of vegetation types in MU1.
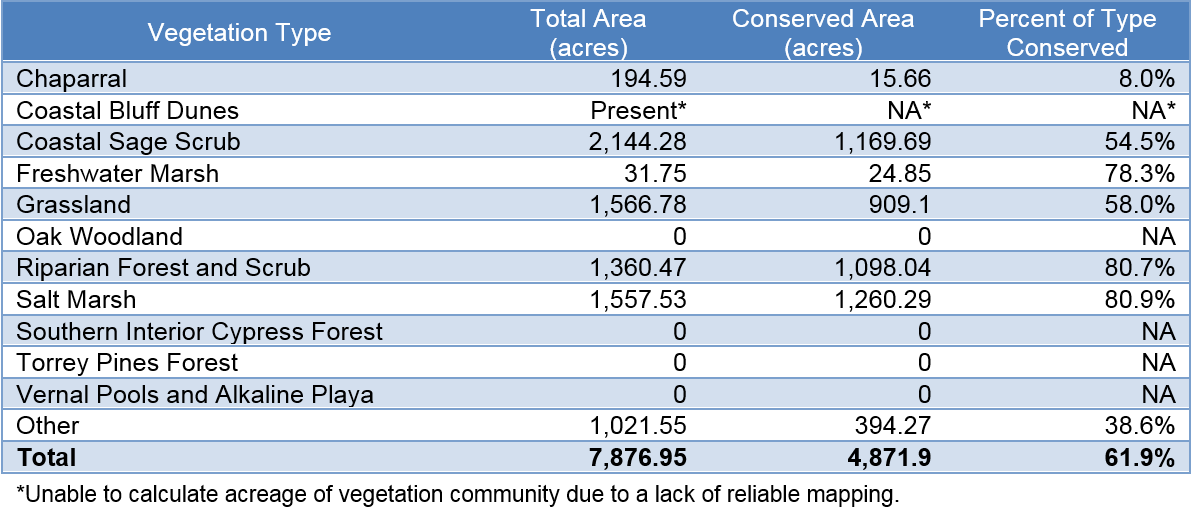
*Unable to calculate acreage of vegetation community due to a lack of reliable mapping.
The San Diego River and the Tijuana River empty into the ocean on the coast, and the Sweetwater and Otay Rivers empty into San Diego Bay in MU1. The streams are low-order and carry large amounts of water draining from the eastern portions of the county and from Mexico. The San Diego and Sweetwater Rivers are channelized in MU1. The San Diego River provides some wetland habitat just south of Mission Bay. The Sweetwater Marsh, part of the San Diego Bay NWR, is at the mouth of the Sweetwater River, where it drains to San Diego Bay. The mouth of Otay River is at the southernmost end of the San Diego Bay, part of which is managed with the San Diego Bay NWR. Finally, the Tijuana River enters the United States in the southern portion of MU1 and drains to the Tijuana Estuary. Because it carries urban runoff from the City of Tijuana, it drains high levels of pollutants and sediments into the estuary.
Very little has burned in MU1, both historically and recently. There is no record of repeated burns in MU1. Only 2 fires have been recorded, both along the U.S.-Mexico border, the Lazy A Fire in 1953 and the Assist #49 Fire in 1983 (see online map).
Section 3.3 includes information about the location, land use, Conserved Lands, vegetation and undeveloped patch size, hydrologic characteristics, and fire history of MU2. Use the online map to view map details for MU2. The map can be found at: https://sdmmp.maps.arcgis.com/apps/webappviewer/index.html?id=1921a2cc291f4570980dbc284dfe2e58.
MU2 is highly urbanized with the majority of habitat is in fragmented urban canyons. It is located just east of MU1. The east edge of MU2 follows I-805 north, east along Olympic Parkway, and north along State Route (SR) 125. The northernmost border follows SR 52 and Torrey Pines Road and includes the La Jolla and Clairemont Mesa areas. A small piece of the western border is along the coast line, including Seal Rock and Bird Rock. MU2 includes portions of the Cities of San Diego, Chula Vista, National City, Lemon Grove, and La Mesa.
MU2 is highly developed, with 85% of the 625,600-acre area urbanized (see online map). Urban development is the most common land use in MU2 and it includes residential (42%), roads (23%), and public facilities (6.2%). Other uses include preserve or open space park (11%), developed open space (2%), vacant and undeveloped (1.7%), water (0.2%), and agriculture (0.02%). MU2 contains dense residential development, including portions of the Cities of La Mesa, Chula Vista, National City, and San Diego. Multiple major freeways fragment the landscape, including Interstates 5, 8, and 805, and SRs 52, 163, 94, and 54.
A total of 3,685 acres are conserved in MU2. Contiguous preserves are relatively small in MU2. Preserves include Tecolote Canyon Natural Park, Marian Bear Memorial Park, and Rose Canyon Open Space (Table V1.3-8). The major preserve landowner is the City of San Diego Park and Recreation Department (see online map).
Table V1.3-8. List of largest preserves and owners/managers in MU2.
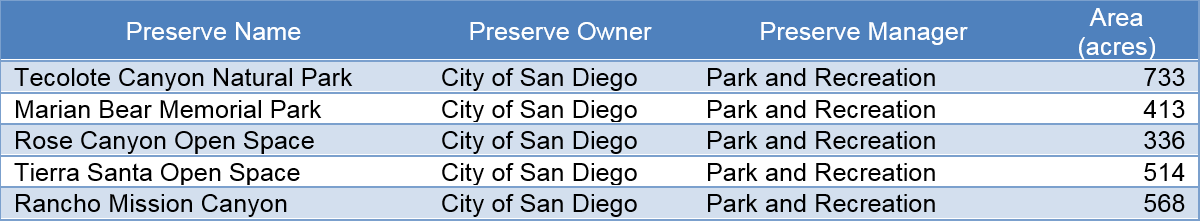
MU2 contains about 3,685 acres of Conserved Land which is split between fragmented canyons surrounded by urban areas, and consists mainly of coastal sage scrub (56%), chaparral (9.6%), and grasslands (8.3%) (see online map). A high number of invasive plant species are present, including Cortaderia selloana, Carpobrotus, Eucalyptus spp., and Arundo donax (CBI et al. 2012). Riparian forest and scrub make up 10.9% of the Conserved Lands and is located along the San Diego River.
Table V1.3-9 displays the acres and percent of each vegetation type conserved. In MU2, the majority of the oak woodlands and riparian forest and scrub is conserved. Most vegetation types have a low level of conservation.
MU2 has a total of 356 patches of contiguous habitat (see online map). The average patch size is 59.5 acres. The primary cause of disruption in habitat is urban roads and residential neighborhoods. The largest patches are located in Mission Gorge, downstream of Mission Trails, in Tecolote Canyon, and in the canyons south of I-8.
Table V1.3-9. Total acres and percent conservation of vegetation types in MU2.
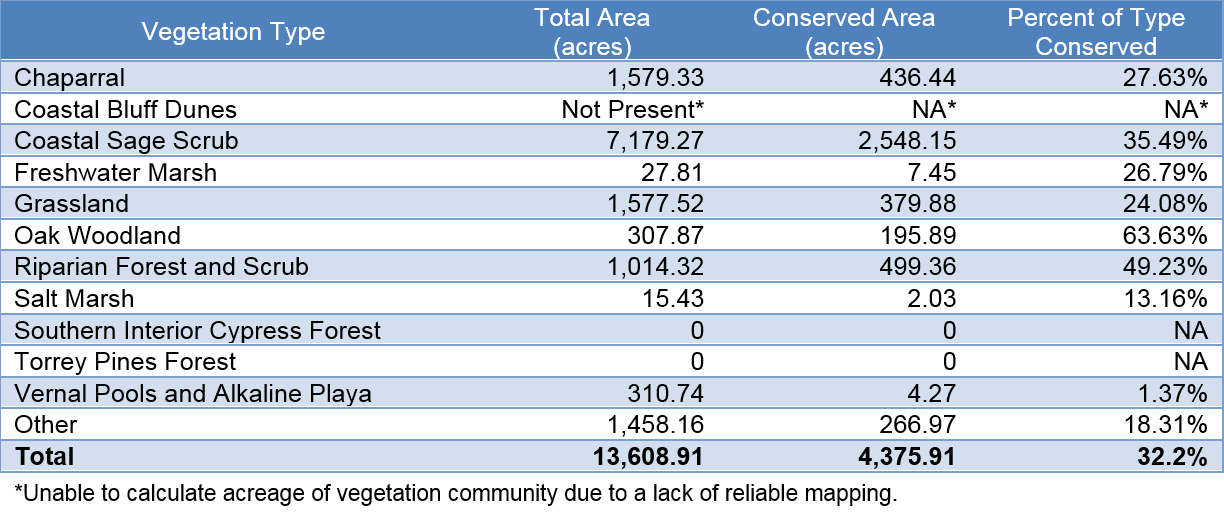
*Unable to calculate acreage of vegetation community due to a lack of reliable mapping.
MU2 contains higher-elevation mesa tops with steep canyon drainages. It continues along a topographical gradient with MU1, with the San Diego River passing through from east to west. The San Diego River is channelized in MU2 and surrounded by urban development. Steep canyons carry water to the river channel, bringing runoff from urban developments including North Park, Qualcomm Stadium, and Mission/Fashion Valley.
Eight fires, including the Cedar Fire in 2003 and the Lehr Fire in 1985, have burned a total of 9,617 acres in MU2 (see online map). Since 1878, 82 acres have burned twice. Just under 25% of the Conserved Land has burned at least once. Most of the burned area was in small urban canyons in fires that occurred before 1950.
Section 3.4 includes information about the location, land use, Conserved Lands, vegetation and undeveloped patch size, hydrologic characteristics, and fire history of MU3. Use the online map to view map details for MU3. The map can be found at: https://sdmmp.maps.arcgis.com/apps/webappviewer/index.html?id=1921a2cc291f4570980dbc284dfe2e58.
MU3 is the southeastern portion of the MSPA. The MU is bordered to the south by Mexico, to the west by MU1 and I-5, and to the north by I-8. The eastern edge is generally the eastern boundary of the MSCP plan area and the MU11 border. Jurisdictions within MU3 include the County of San Diego, and portions of the Cities of San Diego, Chula Vista, El Cajon, and La Mesa. Unincorporated communities in MU3 include Jamul, Rancho San Diego, and part of Alpine.
The majority of MU3 is undeveloped (see online map). The undeveloped area includes Conserved Lands in preserve or open space parks (41% of the total area), vacant and undeveloped land (17%), developed open space (1.3%), and open water (1%). Anthropogenic uses in MU3 include residential (23%), roads (6%), and agriculture (1.3%). Large portions of Conserved Land include contiguous single or adjacent preserves that provide large habitat patches. Major roads or highways that bisect habitat are relatively few (SR 94, Otay Lakes Road, and SR 125) and are generally clustered in the western portion of the MU.
MU3 contains a total of 84,799 acres of Conserved Lands (see online map). MU3 also contains a large concentration of contiguous preserves, which are primarily owned and managed by federal, state, and local governments (Table V1.3-10). BLM is the largest land holder in MU3 with over 25,000 acres. The parcels are not contiguous but the majority of BLM land is in a large holding within Otay Mountain Wilderness Area.
ajor land holdings, which were acquired by state and federal agencies to assist in the implementation of the MSCP, include CDFW’s Hollenbeck Canyon Wildlife Area, Rancho Jamul, Sycuan Peak, Crestridge Ecological Reserves (managed by the EHC), and the USFWS’s San Diego NWR. The City of San Diego Public Utilities Department has also dedicated significant lands within MU3 to protect its water supply reservoirs and to implement the MSCP. These include lands around Upper and Lower Otay Lakes property (City of San Diego Cornerstone Lands) and in Marron Valley (City of San Diego mitigation bank) along the U.S.-Mexico border.
Table V1.3-10. List of largest preserves and owners/managers in MU3.
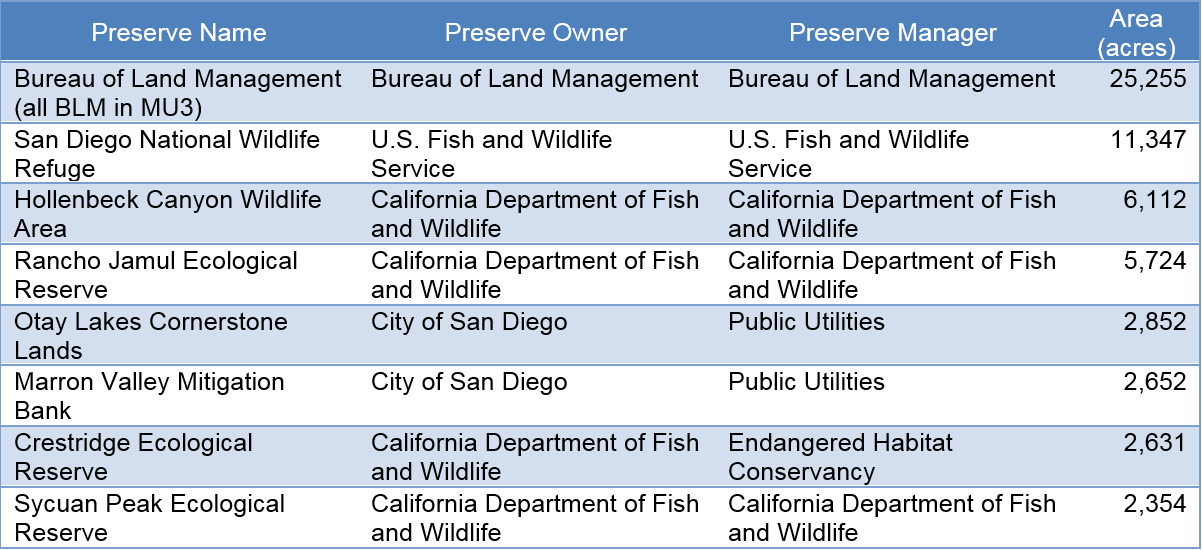
The majority of MU3 is undeveloped (see online map). Natural vegetation on Conserved Lands includes coastal sage scrub (43%), chaparral (35%), and grasslands (11%). Water-dominated vegetation makes up a total of 2.6% of Conserved Lands and includes riparian forest and scrub (1.9%), freshwater marsh (0.25%), and vernal pools and alkaline playa (0.46%).
Table V1.3-11 shows the total acres conserved of each vegetation type and the percent of that vegetation type in conservation. In MU3, over half of the area of chaparral, coastal sage scrub, freshwater marsh, southern interior cypress forest, and vernal pools and alkaline playa are conserved. Vegetation types with lower conservation levels include salt marsh and oak woodlands.
MU3 has a total of 364 patches of contiguous habitat with an average size of 974.6 acres (see online map). The average is heavily skewed with a lot of small patches in the west and along the I-8 corridor. There are 7 patches over 6,000 acres completely or partially within MU3. Major barriers to contiguous habitat include SR 94; Otay Lakes Road; and residential development in Chula Vista, Bonita, Spring Valley, and El Cajon.
Table V1.3-11. Total acres and percent conservation of vegetation types in MU3.
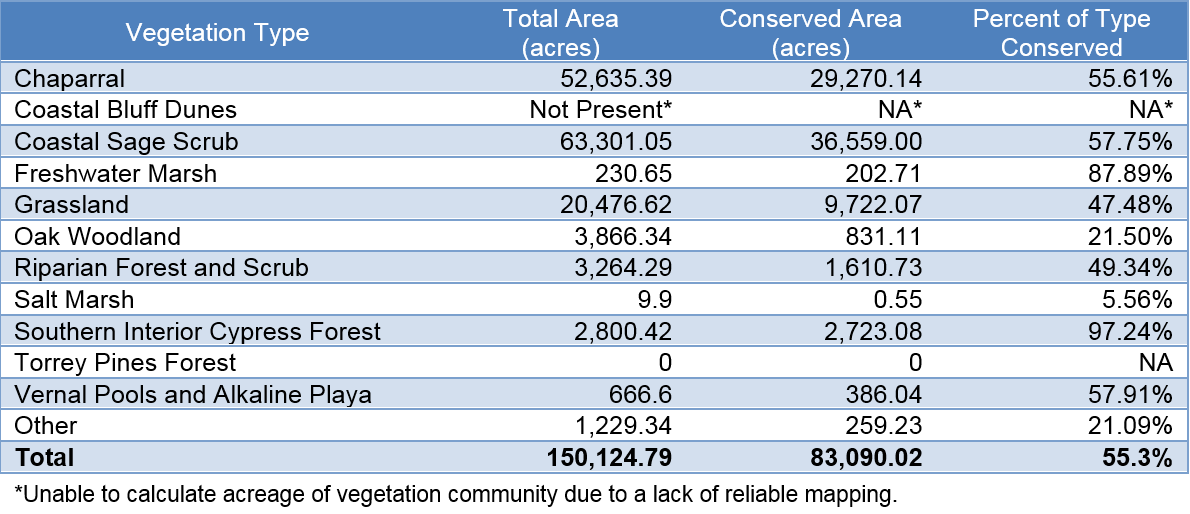
*Unable to calculate acreage of vegetation community due to a lack of reliable mapping.
MU3 contains the headwaters of the Otay River and mid-regions of the Sweetwater and Tijuana Rivers. The MU contains 2 active drinking water reservoirs, Sweetwater Reservoir and Lower Otay Reservoir. Upper Otay Reservoir, on a tributary to Dulzura Creek, is notched and not an active reservoir, although some standing water still remains below the level of the notch. Upstream of the Sweetwater Reservoir, the Sweetwater River has been altered by development, including golf courses and urban areas in Rancho San Diego. The Otay River remains largely intact with some limited disturbances due to agriculture and small community developments. Dulzura Creek is used to transfer water from Barrett Reservoir at the eastern edge of the MSPA to Lower Otay Lake.
About 240 fires have burned in MU3, totaling 147,443 acres burned (see online map). There has been a large amount of repeat burning in MU3 with 8,773 acres burning 5 times and 2,638 acres burning 6 times since 1878. MU3 experienced several of the large fires in 2003 and 2007 including the Cedar Fire, the Harris Fire, and the Mine/Otay Fire. A large portion of MU3 also burned in the Laguna Fire in 1970.
Over 88% of Conserved Lands in MU3 have burned, with 44% burning 3 or more times. Significant portions of Hollenbeck Wildlife Area, San Diego NWR, Crestridge Ecological Reserve, and South Crest Properties have burned 5 or more times.
Section 3.5 includes information about the location, land use, Conserved Lands, vegetation and undeveloped patch size, hydrologic characteristics, and fire history of MU4. Use the online map to view map details for MU4. The map can be found at: https://sdmmp.maps.arcgis.com/apps/webappviewer/index.html?id=1921a2cc291f4570980dbc284dfe2e58.
MU4 encompasses a total of 188,199 acres in the middle of the MSPA. The MU is bordered on the west by Interstate (I-) 15, the south by MU3 and I-8, and to the north by Ramona and San Pasqual Valleys. The eastern edge is generally the eastern boundary of the MSCP plan area and includes City of San Diego Public Utilities Department lands around El Capitan and San Vicente Reservoirs. The MU ranges in elevation from less than 200 feet in Mission Trails Regional Park to over 3,500 feet at El Cajon Mountain. MU4 contains 5 reservoirs (San Vicente, El Capitan, Murray, and Miramar Reservoirs, and Lake Poway). Jurisdictions within MU4 include portions of the County of San Diego, and the Cities of Poway, San Diego, El Cajon, Santee, and La Mesa. Unincorporated areas in MU4 include Lakeside and part of Alpine.
The majority of MU4 is undeveloped, which includes preserves and open space (29%), vacant and undeveloped land (29%), and water (2%) (see online map). Of the developed land, residential use (25%) is the most common, with additional land being used for roads (5%), agriculture (3%), and developed open space (1%). Developed land is concentrated in the western portion of the MU with large tracks of open habitat in the east. Several large preserves are nearly contiguous throughout the eastern portion of MU4 and are often separated for short distances by undeveloped but non-Conserved Lands.
Approximately 61,457 acres of Conserved Lands occur in MU4 (see online map). Conserved Land occurs in several large blocks including a piece of the CNF, 2 San Diego reservoir open space properties, Mission Trails Regional Park, and Cañada de San Vicente (Table V1.3-12).
Table V1.3-12. List of largest preserves and owners/managers in MU4.
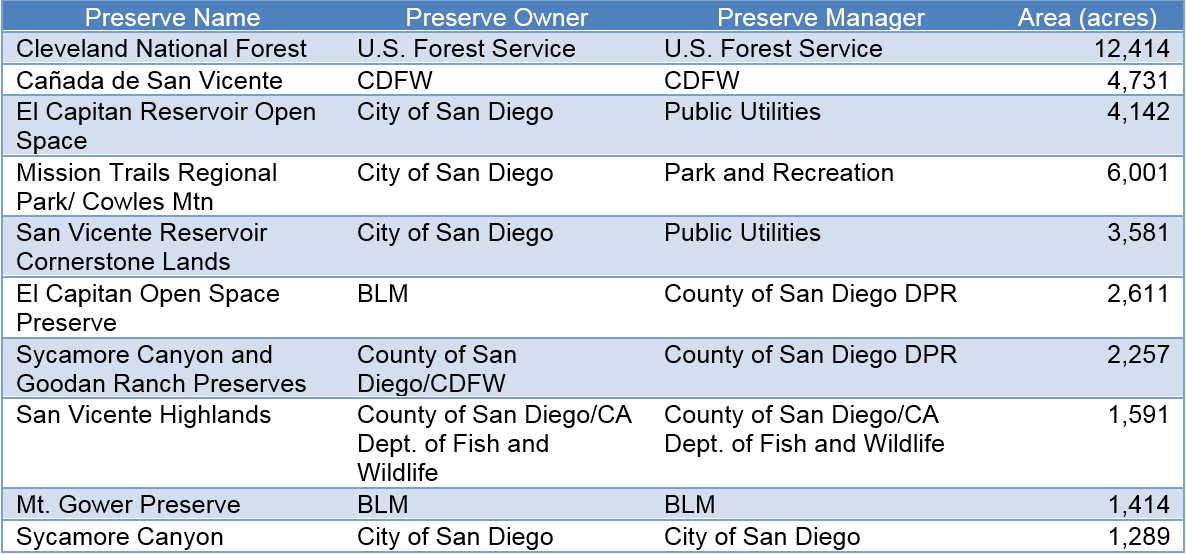
MU4 includes concentrations of urban developed interspersed in a matrix of more rural areas and Conserved Lands. Only 36% is urbanized (see online map) and the urban areas are concentrated in the south and west (Cities of San Diego, El Cajon, La Mesa, and Santee and the community of Lakeside) and northwest (City of Poway). Conserved Lands in MU4 are predominantly chaparral (57%) and coastal sage scrub (28%). Riparian vegetation only makes up 1.7% of Conserved Lands. Other vegetation types present include grasslands (4%) and oak woodlands (2.2%).
Table V1.3-13 lists the total acreage and percentage of each vegetation type conserved in MU4. The majority of the freshwater marsh and vernal pools and alkaline playas are conserved. Vegetation communities with less than 40% conservation include grasslands, oak woodlands, and riparian forest and scrub.
MU4 has a total of 333 patches of contiguous habitat with an average size of 996.1 acres (see online map). The largest patch in MU4 is 114,315 acres but most of the patch extends in MU10. The largest patch fully contained in MU4 is 27,937 acres and covers San Vicente Reservoir, San Vicente Highlands, and Cañada de San Vicente. A large patch, located just west of San Vicente Reservoir, includes portions of MCAS Miramar but military lands were not included in the acreage calculations. These 2 major patches are separated by SR 67.
Table V1.3-13. Total acres and percent conservation of vegetation types in MU4.
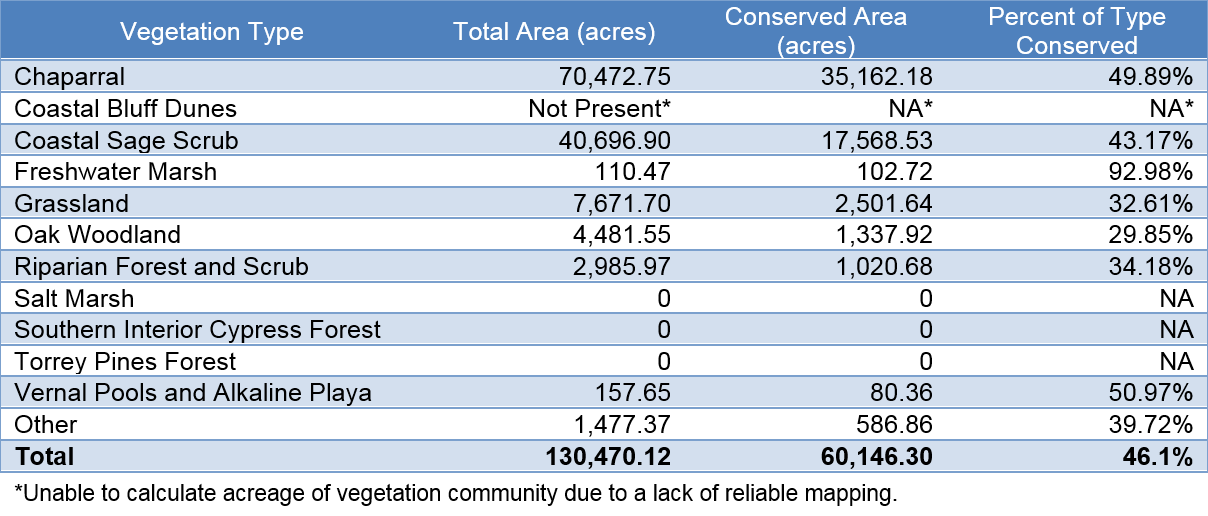
*Unable to calculate acreage of vegetation community due to a lack of reliable mapping.
MU4 has 5 water storage facilities: San Vicente, El Capitan, Murray, and Miramar Reservoirs, and Lake Poway. All except Lake Poway are managed by the City of San Diego Public Utilities Department as part of the City’s drinking water infrastructure. Water from San Vicente and El Capitan are transferred to treatment facilities via pipelines. A large portion of the San Diego River runs through MU4 from the El Capitan Reservoir to Mission Trails Regional Park. The river is generally natural although some stretches are altered in urban areas. A major tributary to the San Diego River, San Vicente Creek, runs from the northeast corner of the MU and flows into the San Diego River just north of Lakeside.
MU4 has the second highest amount of burned land in the MSPA, with 155,751 acres burning at least once (see online map). Significant portions of the MU have burned multiple times. Over 10,000 acres have burned 5 times and over 5,000 acres have burned 6 or more times. Most recently, the Cedar Fire, in 2003, burned over half of MU4 and the Witch Fire, in 2007, burned a small portion of the MU in the north.
Over 91% of Conserved Lands have burned in MU4. Over 27% have burned 4 or more times. The Cedar Fire in 2003 burned all of the Conserved Lands except pieces of Sabre Springs/Scripps Ranch and Blue Sky Ecological Reserve. The majority of CNF in MU4 and areas surrounding El Capitan Reservoir have burned at least 6 times.
Section 3.6 includes information about the location, land use, Conserved Lands, vegetation and undeveloped patch size, hydrologic characteristics, and fire history of MU5. Use the online map to view map details for MU5. The map can be found at: https://sdmmp.maps.arcgis.com/apps/webappviewer/index.html?id=1921a2cc291f4570980dbc284dfe2e58.
MU5 abuts MU4 on the south, MU6 on the west, MU8 to the northwest, and MUs 9 and 10 to the east. The eastern edge is generally the eastern boundary of the MSCP plan area and includes the City of San Diego Public Utilities Department land at Sutherland Reservoir. The MU ranges in elevation from 4,221 feet at Pine Mountain and 436 feet in the upper San Pasqual Valley. The southern portion is bisected by SR 78, which runs through Santa Ysabel Creek and the city of Ramona. Jurisdictions within MU5 include portions of San Diego County and the City.
The majority of land in MU5 remains undeveloped with 35% vacant and undeveloped and 34% in a preserve or open space (see online map). Developed land uses include residential (14%), agriculture (12%) (mainly ranching in Rancho Guejito), and roads (1%). Developed land is concentrated in Ramona, in the southern portion of MU5, with some sporadic rural development in the northwest. Development is largely residential with only a few locations of commercial or industrial development in Ramona.
MU5 contains just over 41,400 acres of conserved land. Conserved Lands generally occur in large blocks separated by undeveloped land (see online map). The City of San Diego Public Utilities Department owns and manages a significant area of land to protect source water reservoirs and important habitat in MU5 (Table V1.3-14). The County owns and manages 2 large preserves in MU5, Hellhole Canyon and Ramona Grasslands. The CNF manages the largest blocks of Conserved Land in MU5.
Table V1.3-14. List of largest preserves and owners/managers in MU5.
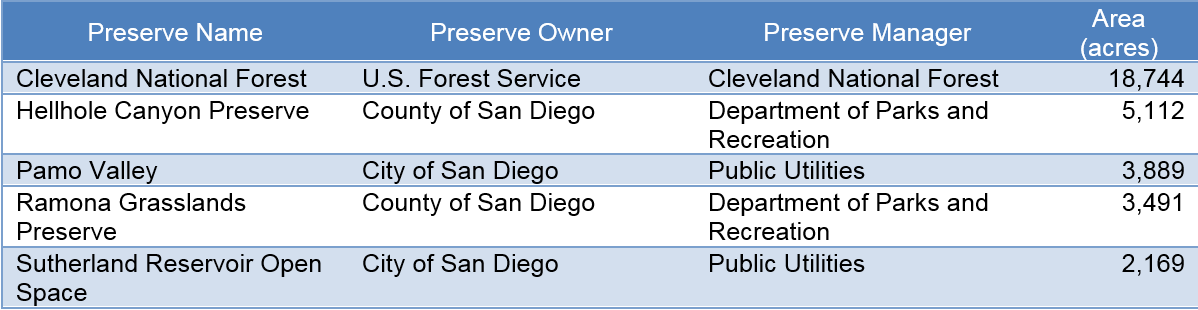
The majority of the vegetation on Conserved Lands is chaparral (69% of Conserved Lands in MU5) and coastal sage scrub (12%) (see online map). Other important vegetation types include oak woodlands (4%), grasslands (7.5%), and riparian forest and scrub (2.4%). Grasslands are located on the Ramona Grasslands Preserve and in the lower elevation areas of Pamo Valley. Oak woodlands line many of the tributaries leading into Pamo Valley.
Conservation levels in MU5 are anticipated to significantly increase with the implementation of the NCP. Table V1.3-15 totals the acres and percent conserved by vegetation type. In MU5, over half of the freshwater marsh is conserved. Vegetation types largely un-conserved include grasslands, oak woodlands, and vernal pools and alkaline playas.
MU5 has a total of 71 patches of contiguous habitat, with an averages size of 10,638.3 acres (see online map). The largest patch covers most of MU5 and extends into MUs 6, 9, and 10, and is over 105,000 acres in total size. The patch is cut in the south by San Pasqual Valley Road, which separates Ramona Grasslands Preserve from the contiguous habitat just to the north.
Table V1.3-15. Total acres and percent conservation of vegetation types in MU5.

*Unable to calculate acreage of vegetation community due to a lack of reliable mapping.
MU5 contains mainly high-order streams and the headwaters of the San Dieguito River (Santa Ysabel Creek). Santa Ysabel Creek is dammed at Sutherland Reservoir. The MU also includes the most intact stream watershed (Guejito Creek) in the MSPA and drains to the San Dieguito River just upstream from MU6.
The northern portion of MU5 contains the headwaters of the San Luis Rey River, which drains to the Pacific Ocean in MU7. These creeks are largely undisturbed in MU5. Santa Ysabel Creek collects runoff and non-point source pollution from Ramona while the San Luis Rey River’s drainage is largely undeveloped. Water from Sutherland Reservoir is released into the natural streambed that moves water to the Hodges Reservoir downstream.
About 114 fires have burned through MU5. A total of 108,492 acres have burned at least once. Over 16,000 acres have burned 4 or more times (see online map). The Paradise Fire in 2003 and the Witch and Poomacha Fires in 2007 each burned a significant portion of MU5. With these 3 fires, about 90% of MU5 was burned, leaving about 11,000 acres unburned.
Over 95% of MU5 has burned since 1878 and over 25% has burned 4 or more times. National Forest and City of San Diego Public Utilities Department land in Pamo Valley have burned multiple times, including a portion that has burned at least 6 times. Hellhole Canyon and Ramona Grasslands have burned at least once, with portions of each burning up to 3 times.
Section 3.7 includes information about the location, land use, Conserved Lands, vegetation and undeveloped patch size, hydrologic characteristics, and fire history of MU6. Use the online map to view map details for MU6. The map can be found at: https://sdmmp.maps.arcgis.com/apps/webappviewer/index.html?id=1921a2cc291f4570980dbc284dfe2e58.
MU6 is in the northwest portion of the MSPA. It covers a total of over 200,000 acres and is bordered by MU7 and the coastal lagoons to the west, MU5 to the east, SR 78 to the north, and SR 56 to the south. MU6 includes lands under the jurisdiction of the cities of Carlsbad, Encinitas, Escondido, Oceanside, Poway, San Diego, San Marcos, and Vista. The MU includes unincorporated lands under the jurisdiction of the County of San Diego, such as the community of Valley Center. MU6 contains several significant water bodies such as Lake Wohlford, Lake Hodges, and Olivenhain Reservoir. MU6 ranges in elevation from near sea level at its western edge to over 2,430 feet at Bear Ridge.
MU6 is highly urbanized with almost 60% of the land developed (see online map). Developed categories include residential (23%), roads (9%), and commercial (4%). Preserves or open space covers 23% with vacant and undeveloped land covering 11%. Land uses are evenly distributed throughout the MU with high density urbanization throughout the area.
There are almost 50,000 acres of Conserved Lands in MU6 (see online map). There are several larger preserve areas including Los Peñasquitos Canyon Preserve, Daley Ranch Preserve, and the City of San Diego Public Utilities Department’s Hodges Reservoir/San Pasqual Valley (Table V1.3-16) lands. Many smaller preserves are along the major stream corridors, just upstream of the lagoons in MU7. Preserve owners/managers in MU6 include CDFW; the Center for Natural Lands Management and the cities of Carlsbad, San Diego, and Escondido.
Table V1.3-16. List of largest preserves and owners/managers in MU6.
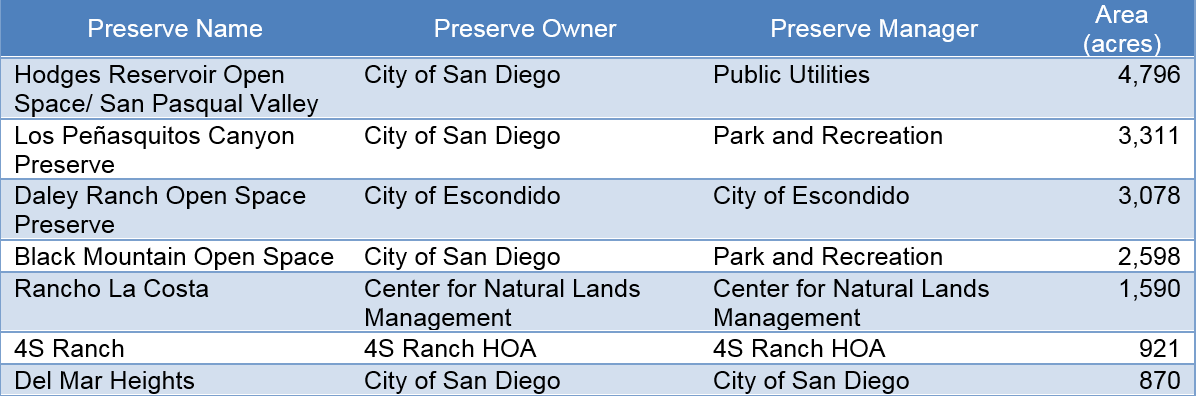
On Conserved Lands, patches of chaparral (36% of the Conserved Lands in MU6) and coastal sage scrub (27%) are present in the central and northeast portions of the MU (see online map). Stream corridors include riparian forest and scrub (7.7%) and oak woodlands (3.5%). Grasslands make up over 21% of the Conserved Lands in MU6. Vegetation in MU6 is highly fragmented and mixed. Patches of coastal sage scrub, chaparral, and grasslands occur throughout the MU.
Table V1.3-17 displays the total acres of each vegetation type and percent of that type conserved. In MU6, the majority of freshwater marsh and salt marsh is conserved. Vegetation types with a small percent conserved include oak woodlands, grasslands, and coastal sage scrub.
MU6 has a total of 956 patches of contiguous habitat, averaging 231.7 acres (see online map). The largest patch wholly contained in MU6 is 8,600 acres and includes Elfin Forest to Sage Hill. Conserved Land in this area is not contiguous and many pieces of this patch are owned privately. Other major patches include Los Peñasquitos, Rancho Santa Fe, and south of California State University San Marcos.
Table V1.3-17. Total acres and percent conservation of vegetation types in MU6.
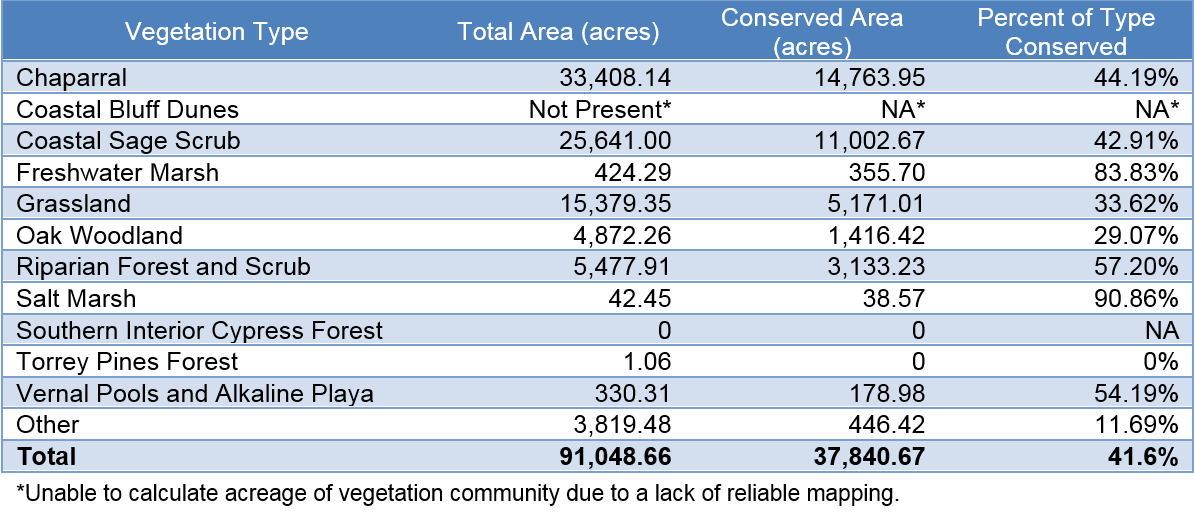
*Unable to calculate acreage of vegetation community due to a lack of reliable mapping.
MU6 includes a number of rivers and streams, including portions of the San Luis Rey and San Dieguito Rivers, and portions of Buena Vista, Agua Hedionda, San Marcos, Escondido, Lusardi, and Los Peñasquitos Creeks. MU6 lies just upstream of the coastal lagoons, where these drainages meet the Pacific Ocean. While the streams differ, most run through heavily developed regions and, as a result, are largely channelized or otherwise modified. The MU contains Lake Hodges, Olivenhain and San Dieguito Reservoirs, and a number of smaller lakes. The reservoirs are part of the San Diego water supply system and water is piped from them to water treatment plants. Therefore, the majority of water downstream of these reservoirs is runoff from the surrounding developed areas.
About 89 fires have burned in MU6. A total of 90,933 acres (45% of MU) have burned at least once since 1878 (see online map). Only 8% of the MU has burned 3 or more times. The Paradise Fire in 2003 burned a large piece of the northeast section of MU6. The Witch Fire in 2007, burned from the east, through the middle of the MU, reaching as far west as Lusardi Creek.
Just over 57% of Conserved Lands have burned in MU6. About 12% have burned 3 or more times. Black Mountain, Lake Hodges, and Daley Ranch have all burned at least once, with pieces burning up to 3 times. The majority of Los Peñasquitos and Robertson Ranch have not burned at all.
Section 3.8 includes information about the location, land use, Conserved Lands, vegetation and undeveloped patch size, hydrologic characteristics, and fire history of MU7. Use the online map to view map details for M71. The map can be found at: https://sdmmp.maps.arcgis.com/apps/webappviewer/index.html?id=1921a2cc291f4570980dbc284dfe2e58.
MU7 includes the northern coast of San Diego County. The MU is bordered to the south by La Jolla, the west by the Pacific Ocean, the east by I-5, and the north by Camp Pendleton. This MU includes the major lagoons in San Diego County including Buena Vista, Agua Hedionda, Batiquitos, San Dieguito, and San Elijo Lagoons. Jurisdictions within MU7 include portions of the cities of Encinitas, Oceanside, Carlsbad, Cardiff by the Sea, Leucadia, Del Mar, San Diego, and Solana Beach.
MU7 is highly urbanized with urban land uses that include residential (27%), roads (16.5%), commercial (5%), and developed open space (2.5%) (see online map). Water within lagoons and lakes make up 6.7% of the MU and agriculture covers 1.3%. Natural land uses include preserve or open space parks (25%) and vacant and undeveloped (2.5%).
Over 5,800 acres of land are conserved in MU7 (30 % of the total area). Conserved Land is split between several lagoon ecological reserves (see online map). These preserves provide habitat for coastal birds such as California least tern and western snowy plover. The major preserve owners/managers include CDPR, CDFW, and the City of Del Mar (Table V1.3-18).
Table V1.3-18. List of largest preserves and owners/managers in MU7.
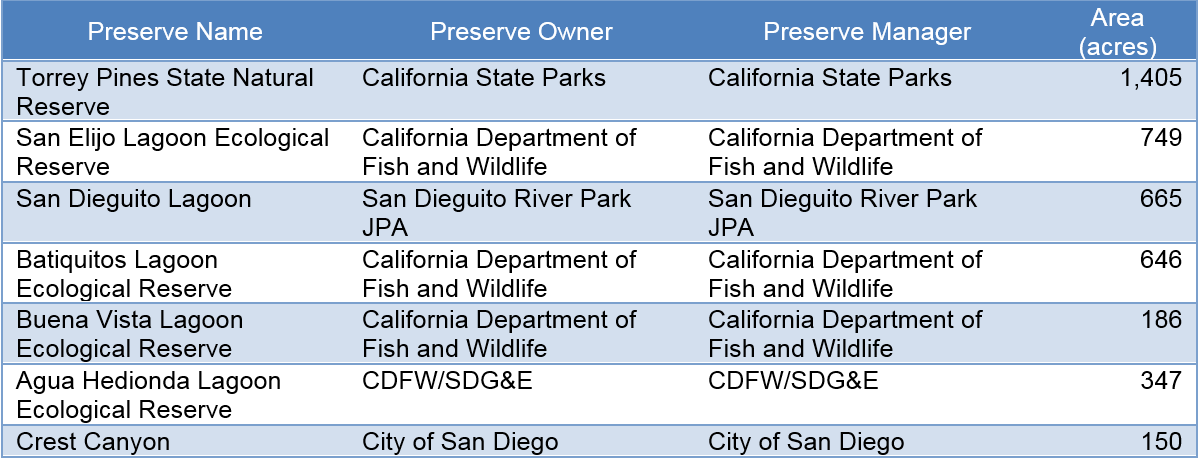
Prominent vegetation on Conserved Lands includes salt marsh (17%), coastal sage scrub (15%), and chaparral (12%) (see online map). Freshwater marsh and riparian forest and scrub make up a total of 17.8%. Most of the upland vegetation types occur immediately adjacent to the Conserved Lands at the various lagoons.
Table V1.3-19 displays the total acres of each vegetation type and percent of that type conserved. In MU7, Torrey pines forest, salt marsh, riparian forest and scrub, and freshwater marsh are largely conserved. Generally, MU7 has a high level of conservation for all vegetation categories because the majority of the un-Conserved Land is urbanized.
MU7 has a total of 88 patches of contiguous habitat, averaging 191.8 acres (see online map). All of the major patches in MU7 are associated with coastal lagoons. All of the lagoons are split by I-5; however, most have significant opportunity for animal movement under bridges.
Table V1.3-19. Total acres and percent conservation of vegetation types in MU7.
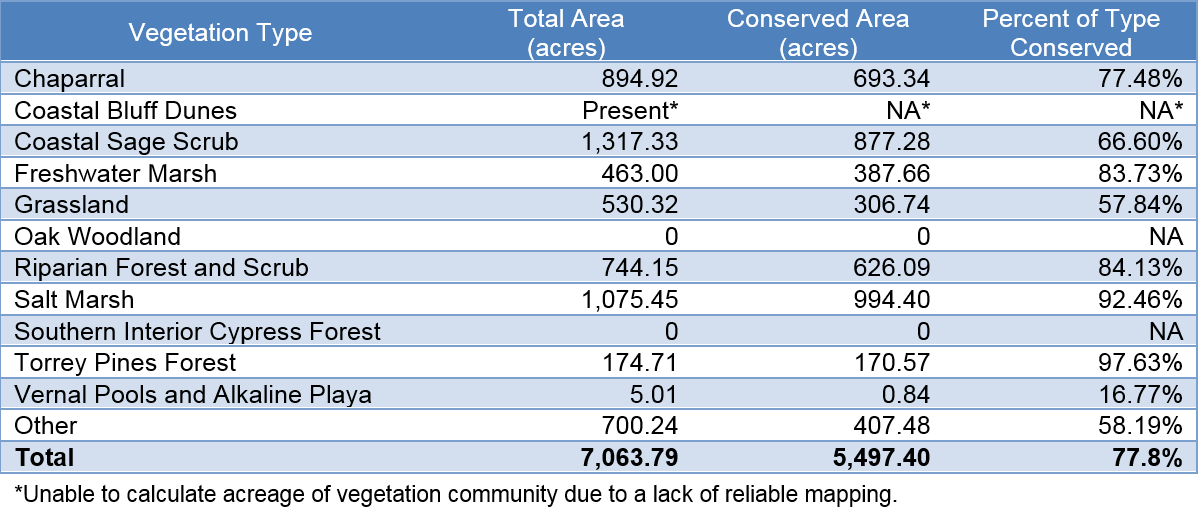
*Unable to calculate acreage of vegetation community due to a lack of reliable mapping.
MU7 includes the outlets of multiple drainages to the ocean, including San Dieguito and San Luis Rey Rivers, and Escondido and San Marcos Creeks. The MU contains dense riparian areas adjacent and upstream to the lagoons. Most of the lagoons are subject to extensive edge effects due to adjacent urban development. Water in the streams and lagoons comes mainly from urban runoff downstream of the reservoirs and can contain a high level of pollution and sediment. Many of the creeks that drain into the lagoons are invaded by nonnative plants.
There is very little history of fire in MU7, with only 1 recorded fire, the Assist #114 Fire in 1986. This fire burned 68 acres in Overlook Park and San Dieguito Lagoon (see online map).
Section 3.9 includes information about the location, land use, Conserved Lands, vegetation and undeveloped patch size, hydrologic characteristics, and fire history of MU8. Use the online map to view map details for MU8. The map can be found at: https://sdmmp.maps.arcgis.com/apps/webappviewer/index.html?id=1921a2cc291f4570980dbc284dfe2e58.
MU8 includes the northern portion of the MSPA. The MU is bordered to the north by the San Diego/Riverside County boundary, to the west by Camp Pendleton and SR 78, to the east by Palomar Mountain and Valley Center, and to the south by SR 78. It includes Bonsall, Fallbrook, and a major stretch of I-15. Jurisdictions within MU8 include portions of San Diego County and the Cities of Vista, San Marcos, Escondido, and Oceanside.
The landscape in MU8 is highly interspersed by agriculture (23.2%) or urbanization (36%), with only 12% of the area in a preserve or open space park and 27% vacant and undeveloped (see online map). Urban land uses include residential (29%), roads (4%), and developed open space (1%). Urban and agriculture are fairly evenly distributed throughout the MU with the exception of the northwest tip, which is largely undeveloped. Large agriculture patches are located along the San Luis Rey River, particularly in the upstream portions.
Over 27,000 acres of land are conserved in MU8 (12.9% of the total area). Large contiguous preserves include a piece of CNF in the north and along the Santa Margarita and San Luis Rey Rivers (see online map). Generally, Conserved Lands are small and fragmented by urbanization or vacant and undeveloped land. The major preserve owners/managers include the USFS, the Fallbrook Conservancy, the County of San Diego Department of Parks and Recreation, and Yuima Municipal Water District (Table V1.3-20). The BLM owns a number of discontiguous parcels throughout MU8.
Table V1.3-20. List of largest preserves and owners/managers in MU8.
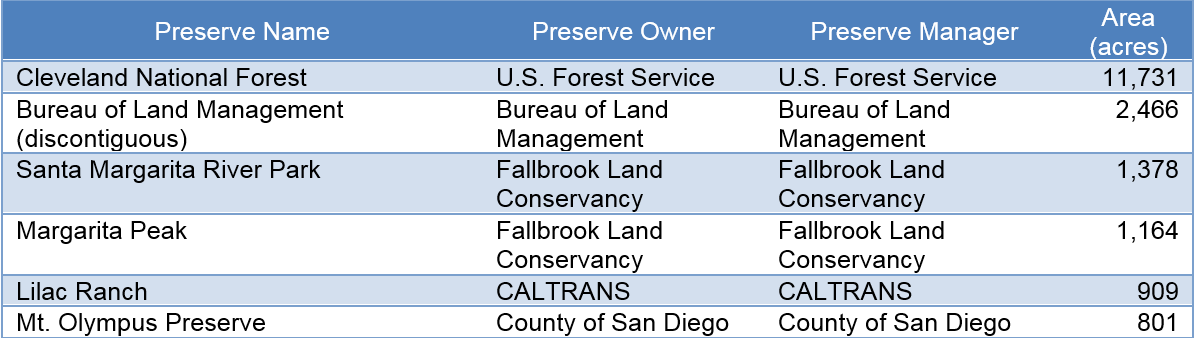
Vegetation on Conserved Lands consists of chaparral (65%), coastal sage scrub (16%), oak woodlands (2.7%), and grasslands (4%). Riparian forest and scrub make up over 8% of the Conserved Lands (see online map). Chaparral and coastal sage scrub occur mainly in the northern portion of the MU. Riparian vegetation occurs almost entirely along the Santa Margarita River.
Table V1.3-21 displays the acres of each vegetation type and the percent of that vegetation type under conservation. In general, a small percent of each vegetation type is conserved. Chaparral is fairly well conserved, whereas all other vegetation categories are not. Riparian communities are more often conserved due to preserves along the Santa Margarita and San Luis Rey Rivers.
MU8 has a total of 728 patches of contiguous habitat, averaging 909.1 acres (see online map). The largest patch is over 20,000 acres and is located within the CNF in the most northwestern portion of the MU. Other significant patches include Mt. Olympus/Pala Reservation, Pauma Valley, and the Merriam Mountains along the I-15 corridor.
Table V1.3-21. Total acres and percent conservation of vegetation types in MU8.
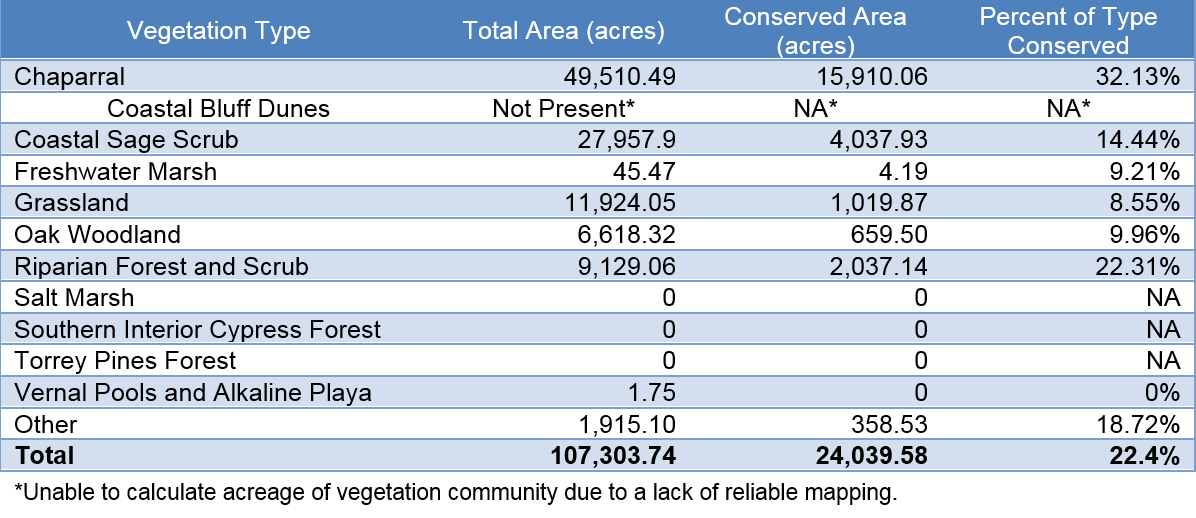
*Unable to calculate acreage of vegetation community due to a lack of reliable mapping.
The Santa Margarita and San Luis Rey Rivers pass through MU8. The Santa Margarita River passes through a narrow portion of MU8 but a large area of land surrounding it is conserved by the Fallbrook Land Conservancy. The San Luis Rey River runs east to west through the widest portion of the MU. Areas just along the stream are conserved in the western portion, but largely un-conserved upstream. The river is not channelized but is confined by natural banks as it runs through agriculture fields and urban areas. There are no major lakes or reservoirs along either stream in MU8.
About 172 fires have burned in MU8. A total of 105,088 acres (49% of the MU) have burned since 1878 (see online map). Major fires in MU8 include the Steward Fire in 1958, the Paradise Fire in 2003, and the Poomacha Fire in 2007. MU8 abuts MCBCP which has experienced a large number of fires. Margarita Peak, along the border of Camp Pendleton, has burned up to 9 times.
Over 75% of the Conserved Lands in MU8 have burned. About 23% of the Conserved Lands have burned 4 or more times. However, the majority of repeat burns occurred in the northwest-most corner of the MU. With the exception of Margarita Peak, the majority of Conserved Land has burned only once. Portions of Lilac Ranch, San Luis Rey River, and Daley Ranch have no record of burns.
Section 3.10 includes information about the location, land use, Conserved Lands, vegetation and undeveloped patch size, hydrologic characteristics, and fire history of MU9. Use the online map to view map details for MU9. The map can be found at: https://sdmmp.maps.arcgis.com/apps/webappviewer/index.html?id=1921a2cc291f4570980dbc284dfe2e58.
MU9 includes the northeasternmost part of the MSPA and covers a total of 229,778 acres. It is bordered to the north by Riverside County, to the west by MUs 8 and 5, and to the south by MU10 and SR 76. The eastern border follows the top of the watershed divide. MU9 includes Palomar Mountain, Warner Springs, and the Vulcan Mountains. MU9 contains several areas of high elevation. Hot Springs Mountains are about 6,500 feet above sea level. The lowest elevations are in and surrounding Lake Henshaw and range from 2,700–2,900 feet above sea level. All of MU9 falls into San Diego County unincorporated area.
MU9 is largely undeveloped with preserves or open space parks occupying 63% and vacant and undeveloped land encompassing 26% of the MU (see online map). Other land uses include residential (4.7%), agriculture (2.7%), and commercial (0.5%). Development is concentrated around Palomar Mountain, Dodge Valley, Ranchita, and Santa Ysabel. Large patches of undeveloped land exist throughout the MU.
Almost 138,000 acres of land are conserved in MU9 (see online map). Over 45% of the Conserved Land in MU9 is owned and managed by the USFS as part of the CNF. Conserved Lands are generally contiguous with gaps for several Indian reservations: Los Coyotes Reservation, Pauma and Yuima Reservation, and San Ysabel Reservation. Other large land holders include the Vista Irrigation District, BLM, and California State Parks (Table V1.3-22).
Table V1.3-22. List of largest preserves and owners/managers in MU9.
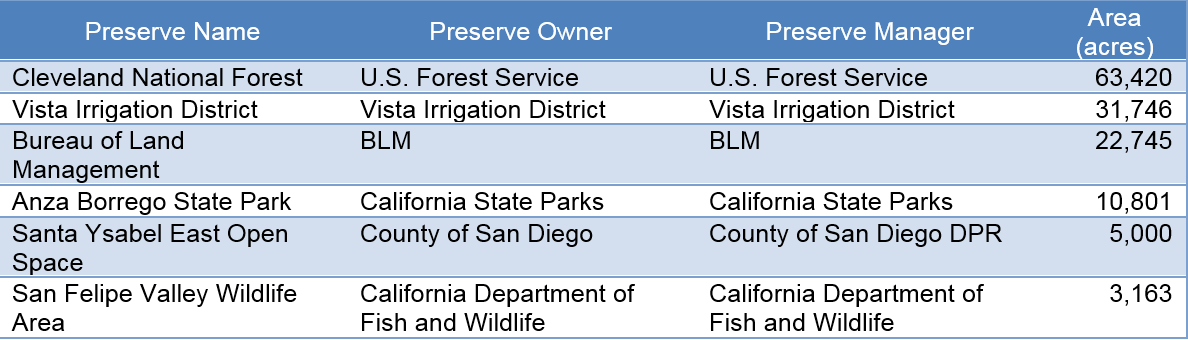
The most dominate vegetation types on Conserved Lands in MU9 are chaparral (70%) and grasslands (11%) (see online map). Water-dominated vegetation types include freshwater marsh (0.7%) and riparian forest and scrub (1.7%). Other vegetation types include coastal sage scrub (1.5%) and oak woodlands (4.7%). A large, contiguous grassland is located in the basin containing Lake Henshaw. Stands of hardwood and conifer forests (classified under "Other") are located on Palomar Mountain.
Table V1.3-23 displays the acres of each vegetation type and the percent of that vegetation type under conservation. Vegetation categories that are over 50% conserved include chaparral, grassland, oak woodlands, and vernal pools and alkaline playa. Smaller percentages of coastal sage scrub, freshwater marsh, and riparian forest and scrub are conserved.
MU9 has a total of 34 patches of contiguous habitat, averaging 17,756.6 acres (see online map). All of MU9 consists of just 5 major patches. The habitat is broken up by SR 79 and small roads through mountain passes. The largest patch is over 108,000 acres and is located almost entirely in MU9.
Table V1.3-23. Total acres and percent conservation of vegetation types in MU9.
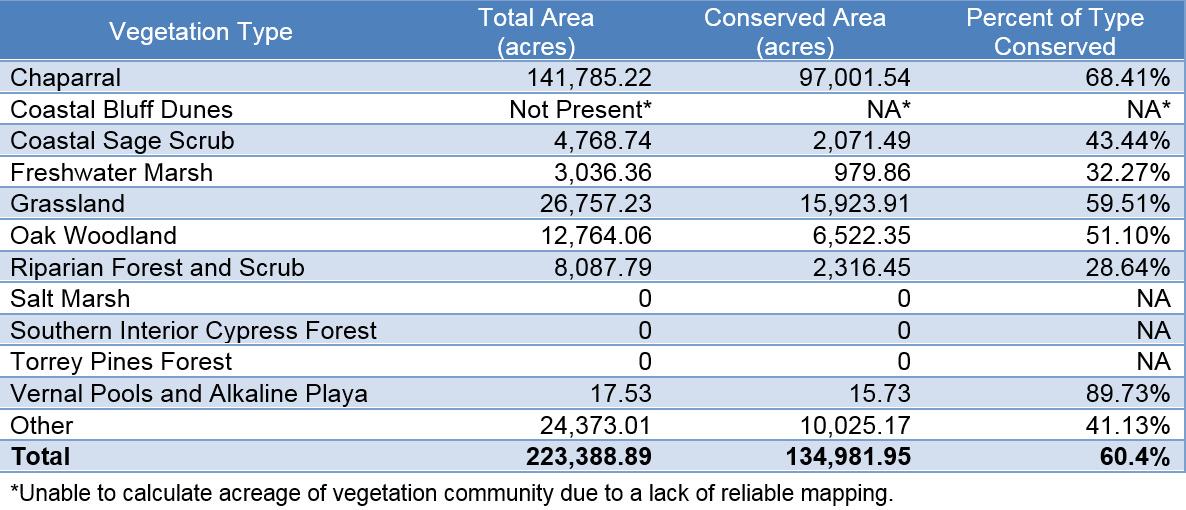
*Unable to calculate acreage of vegetation community due to a lack of reliable mapping.
MU9 encompasses the upper portions of San Luis Rey and Santa Margarita watersheds. The easternmost boundary follows the watershed divide of the San Luis Rey River. As a result, the streams in MU9 are small and scattered, collecting into a larger stream at Lake Henshaw. The West Fork San Luis Rey River is the main water feature through Palomar Mountain. In the western portion of the MU, several tributaries flow from the Agua Tibia Mountains, including Agua Tibia Creek, Frey Creek, and Pauma Creek.
About 72% of MU9, or 164,973 acres, has burned since 1878(see online map). A total of 117 fires have burned through MU9, including the Cedar and Coyote Fires in 2003 and the Poomacha Fire in 2007. A large piece of the southern tip of MU9 also burned in the Pines Fire in 2002. While a significant percentage of the MU has burned, very little has burned multiple times. Less than 5% of the MU has burned 3 or more times.
On Conserved Lands in MU9, 105,484 acres (76% of conserved land) have burned at least once. Only 12% has burned twice and 2% has burned 3 or more times. Most of the CNF has burned once, with small portions burning twice. Parts of the Vista Irrigation District and San Ysabel Open Space have no record of burns.
Section 3.11 includes information about the location, land use, Conserved Lands, vegetation and undeveloped patch size, hydrologic characteristics, and fire history of MU10. Use the online map to view map details for MU10. The map can be found at: https://sdmmp.maps.arcgis.com/apps/webappviewer/index.html?id=1921a2cc291f4570980dbc284dfe2e58.
MU10 covers 242,560 acres of the eastern parts of the San Dieguito, San Diego, Sweetwater, and Tijuana watersheds. It is bordered to the north by MU9 and SR 76, to the west by MUs 4 and 5, and to the south by MU11 and I-8. The eastern edge follows the top of the watershed divides. All of MU10 falls into San Diego County unincorporated area. MU10 includes Pine Valley, Mt. Laguna, Santa Ysabel, and the Cuyamaca Mountains. Elevations range from about 800 feet to over 6,000 feet above sea level.
The majority of MU10 is undeveloped, which is split between preserve or open space park (55%) and vacant and undeveloped land (29.9%) (see online map). Urban development includes residential (7.3%), roads (8%), and recreation (0.8%). All other land uses make up less than 1% of the land use. Development is concentrated in Julian, Alpine, and Campo. Large patches of contiguous habitat exist throughout the MU.
A total of 140,315 acres are conserved in MU10 (see online map). Over 70% of the Conserved Lands in MU10 are owned by the USFS and managed as part of the CNF. Other large land holders include California State Parks and the County of San Diego. Conserved Land in the southern portion of the MU is largely contiguous (Table V1.3-24). The northern portion contains gaps in the Conserved Lands at Santa Ysabel Reservation, Mesa Grande Reservation, and Witch Creek.
Table V1.3-24. List of largest preserves and owners/managers in MU10.
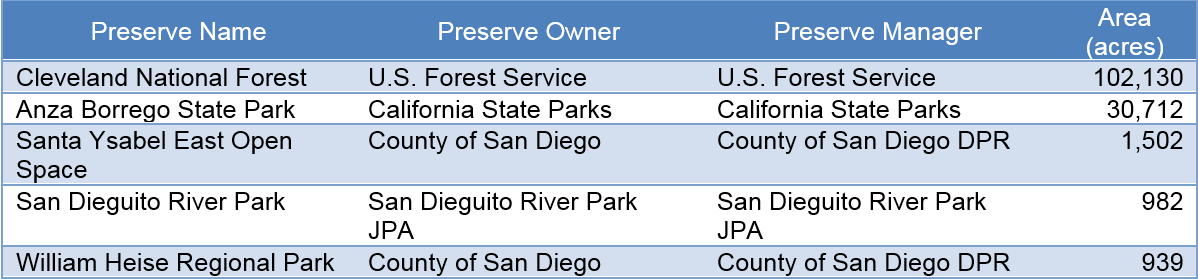
The dominate vegetation types on Conserved Lands in MU10 are chaparral (68%) and coastal sage scrub (7.6%) (see online map). A large percentage of the MU is designated as "other" vegetation (12.5%). This vegetation is primarily hardwood forests on the mountain tops. Other vegetation types include oak woodlands (5.7%), grasslands (4.7%), and riparian forest and scrub (0.5%). Coastal sage scrub occurs almost exclusively in the upper San Diego River valley. Fairly large grassland areas are located in meadows throughout the Laguna Mountains.
Table V1.3-25 displays the acres of each vegetation type and the percent of that vegetation type under conservation. Vegetation categories with over 50% conserved include chaparral, coastal sage scrub, freshwater marsh, and other (mainly hardwood forests). A smaller percentage of riparian forest and scrub and grasslands are conserved.
MU10 has a total of 101 patches of contiguous habitat, averaging 9,132.2 acres (see online map). MU10 is characterized by large patches separated by small mountain highways, such as SR 79. The largest patch is over 114,000 acres and split between MU10 and MU4.
Table V1.3-25. Total acres and percent conservation of vegetation types in MU10.
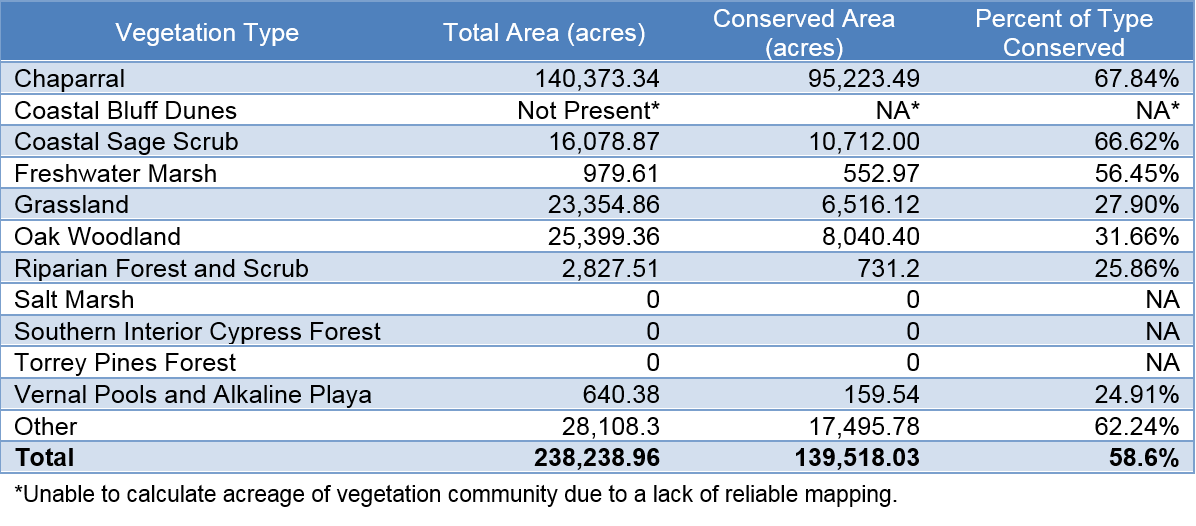
*Unable to calculate acreage of vegetation community due to a lack of reliable mapping.
MU10 contains the upper reaches of the San Diego River, Sweetwater River, and the Tijuana River watersheds and a portion of the San Luis Rey River watershed. South of Julian, the MU boundary follows the watershed divides. Most of the MU contains small, mountain streams that collect together in the western piece of the MU. MU10 includes Cuyamaca Lake, located high in the Cuyamaca Mountains.
Almost 180 fires have burned through MU10, including the Cedar and Paradise Fires in 2003, the Witch Fire in 2007, and the Laguna Fire in 1970 (see online map). Almost 90% of the MU has burned at least once and 27% burned 3 or more times. Most repeat burns took place at the border between MU10 and MU5 in Pamo Valley and the border between MU10 and MU4 near El Capitan Reservoir.
On Conserved Lands in MU10, 128,714 acres (91%) have burned at least once. Over 30% of the Conserved Lands have burned 3 or more times. Parts of the CNF, near Eagle Peak and along the upper San Diego River have burned at least 5 times. Additionally, USFS land near Lake Henshaw has burned 3 or 4 times.
Section 3.12 includes information about the location, land use, Conserved Lands, vegetation and undeveloped patch size, hydrologic characteristics, and fire history of MU11. Use the online map to view map details for MU11. The map can be found at: https://sdmmp.maps.arcgis.com/apps/webappviewer/index.html?id=1921a2cc291f4570980dbc284dfe2e58.
MU11 covers 214,140 acres in the southeast portion of the MSPA. It is bordered to the north by MU10 and I-8, to the west by MU3, and to the south by the U.S.-Mexico border. The east boundary follows the top of the Tijuana watershed divide. MU11 contains 3 reservoirs: Morena Reservoir, Barrett Reservoir, and Loveland Reservoir. MU11 also contains Morena Valley, Hauser Mountain, and the cities of Potrero and Campo. The elevation ranges from 800 feet to about 5,000 feet above sea level.
The majority of land in MU11 is undeveloped with vacant and undeveloped covering 53% and preserve or open space park covering 27.6% (see online map). Urban land uses include residential (12.9%), roads (1.5%), and agriculture (3%). Residential areas are evenly dispersed throughout the MU and many communities break up contiguous patches of habitat.
A total of 115,085 acres are conserved in MU11 (see online map). Over 65% of the Conserved Lands in MU11 are owned by the USFS and are managed as part of the CNF (Table V1.3-26). Other large land owners include BLM and the City of San Diego Public Utilities Department. The majority of Conserved Lands are contiguous with gaps for Potrero, Campo, and Lawson Valley. A large portion of the eastern edge of MU11 contains La Posta Indian Reservation.
Table V1.3-26. List of largest preserves and owners/managers in MU11.
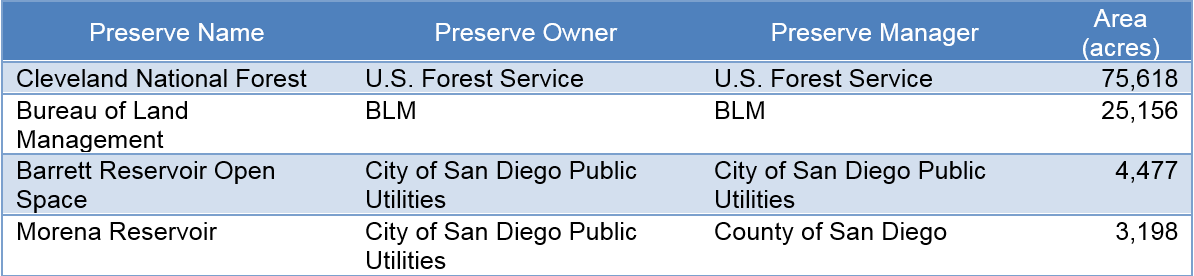
The dominate vegetation types on Conserved Lands in MU11 are chaparral (79%) and coastal sage scrub (13.6%) (see online map). Other important vegetation categories include grassland (2%), oak woodlands (2.6%), and riparian forest and scrub (0.4%). Oak woodlands occur mainly along small tributaries and Hauser Creek. Coastal sage scrub occurs in small patches in the hills surrounding Barrett Reservoir. Grasslands and water-dominate vegetation types are most frequently located around Barrett Reservoir and Morena Reservoir.
Table V1.3-27 displays the acres of each vegetation type and the percent of that vegetation type under conservation. The majority of chaparral, coastal sage scrub, and freshwater marsh are conserved. Smaller amounts of grassland and oak woodlands are on Conserved Lands.
MU11 has a total of 70 patches of contiguous habitat, averaging 4,745.8 acres (see online map). MU11 is characterized mainly by several large patches separated by small highways. The largest patch is over 130,000 acres and is completely contained within MU11. Other major patches are located along the western edge and are located in both MU11 and MU3.
Table V1.3-27. Total acres and percent conservation of vegetation types in MU11.
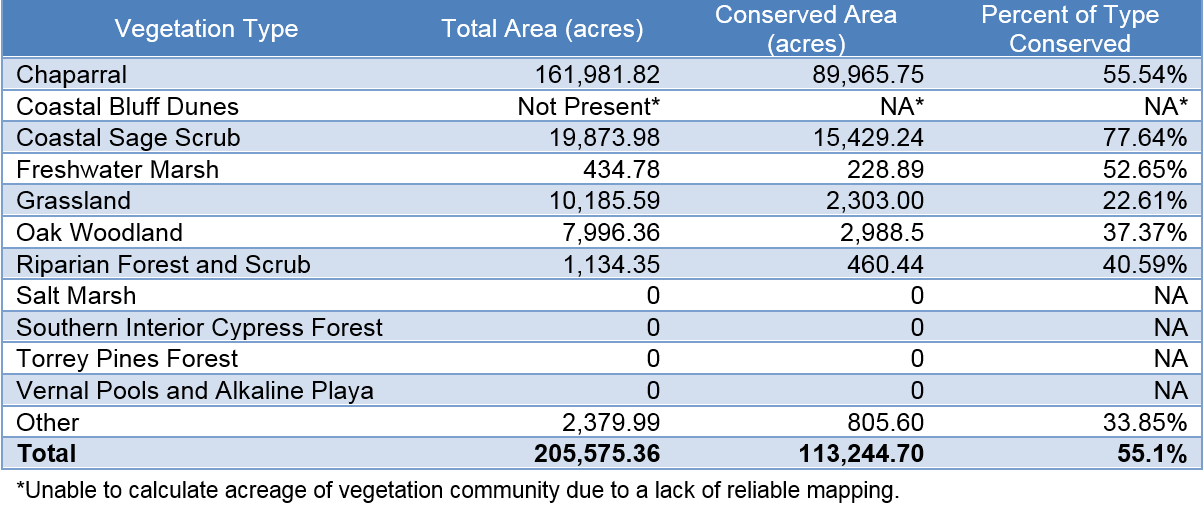
*Unable to calculate acreage of vegetation community due to a lack of reliable mapping.
The majority of MU11 is in the Tijuana River watershed, with a portion of the MU in the mid-section of the Sweetwater River watershed. MU11 is less mountainous than the other eastern MUs (MU9 and MU10). The streams in MU11 collect at Lake Morena and Barrett Lake; both are drinking water reservoirs owned by the City of San Diego Public Utilities Department. The major streams in MU11 include Pine Valley Creek, Espinosa Creek, Cottonwood Creek, and Potrero Creek.
About 238 fires have burned in MU11, including the Cedar Fire in 2003, the Laguna Fire in 1970, and the Harris Fire in 2007 (see online map). A total of 185,570 acres (86% of the MU) have burned at least once. Almost 43,000 acres (20% of the MU) have burned 3 or more times. Small pockets of unburned land exist near Hartley Hill and Big Protrero Truck Trail.
On Conserved Lands in MU11, 106,205 acres (92% of Conserved Lands) have burned at least once. Over 26% of Conserved Lands have burned 3 or more times. The areas with most repeat burns include Corral Canyon east of Barrett Lake, Bull Bluff and the surrounding peaks and canyons, and along the U.S.-Mexico border just east of Tecate, Mexico.
Data management refers to the life cycle of information from creation to secure storage and access (aka "cradle to grave"). A database management system is a method to input, organize, and retrieve data. It consists of (1) a set of tables that contain data values, (2) the relationships between the values and (3) an interface system for users to input, view, or export data in various ways.
The MSP Portal provides a centralized location to manage standardized data collected by any stakeholder in San Diego County. This system facilitates the sharing of information between stakeholders and allows for more in-depth analysis of the data. Users should familiarize themselves with the system so they can provide project information and data, search available datasets, and export or download data from others. The MSP Portal contains systems to input project metadata, raw data, analysis/reports, and maps. In the future, the SDMMP will also provide data collection systems through the MSP Portal, to aid users in field collection and quality assurance and quality control (QAQC). Standard data collection and storage is integral to ecological research and MSP Roadmap implementation.
A data management system aids adaptive management and monitoring programs, long-term studies, regional trends, and statistical modeling. A well-designed data management system is both comprehensive and consistent. Consistency ensures data quality and provides efficiency in use of time and money. A comprehensive database system is especially important for ecological research, which typically studies a wide range of interrelated variables across a large landscape over long periods of time (Williams and Brown 2012; Hunt et al. 2015). The following table highlights the benefits of a well-designed data management system (Table V1.4-1).
Table V1.4-1: Benefits of a data management system.
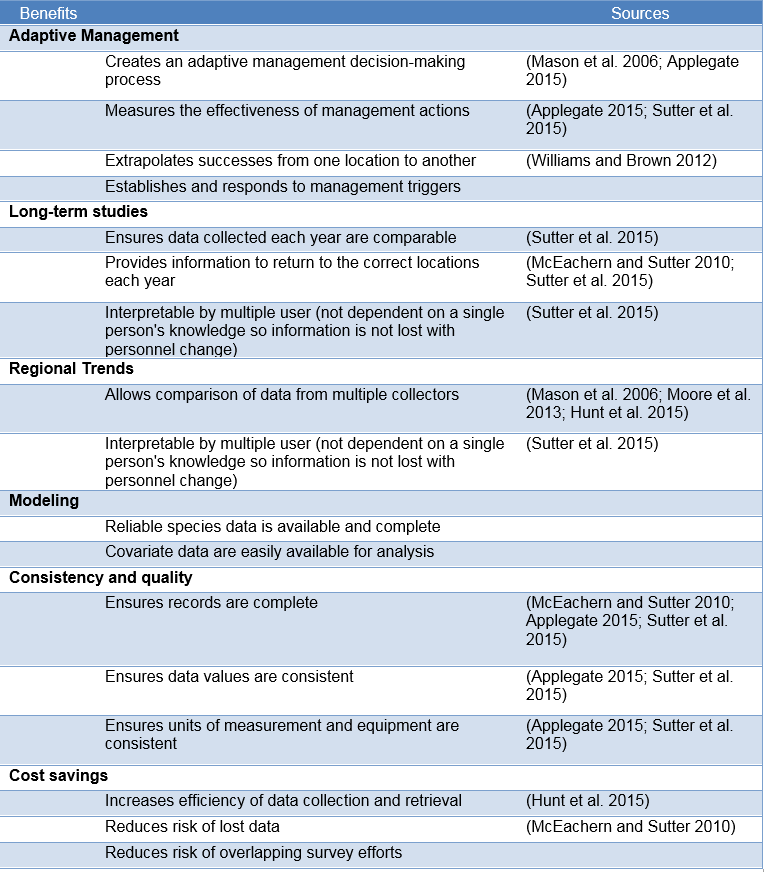
Adaptive management programs depend heavily on the reliable retrieval of data in order to make decisions across the landscape (Williams and Brown 2012; Applegate 2015). Data management facilitates an adaptive management approach by providing users with timely information to make decisions (Mason et al. 2006; Applegate 2015). The system can also be used to measure the effectiveness of management (Applegate 2015; Sutter et al. 2015) and extrapolate outcomes from one location to another by tracking covariate data (Williams and Brown 2012). Data management can also be used to create a trigger system and provide timely information for managers to act.
Data management assists in studying species across both time and space (Mason et al. 2006; McEachern and Sutter 2010; Moore et al. 2013; Hunt et al. 2015; Sutter et al. 2015). Long-term studies depend on storing and retrieving past information and ensuring the data collected each year are comparable (McEachern and Sutter 2010; Sutter et al. 2015). Regional trend studies depend on multiple cooperators collecting data independently in a single year (Mason et al. 2006; Moore et al. 2013; Hunt et al. 2015). A data management system helps ensure that data values are consistent and complete among all users.
Data management systems also aid statistical modeling projects by easily providing researchers with reliable species and covariate data and explicitly tracking the relationships between the values. Statistical models often suffer from incomparable data collected from a variety of different entities. Data are often only available to researchers through written reports that do not provide covariate information in an easily analyzable manner.
A data management system also results in higher-quality data (McEachern and Sutter 2010; Applegate 2015; Sutter et al. 2015). Common techniques to aid QAQC include required fields to ensure the information is complete, restrictions on data values to ensure the data are in the correct format, data ranges to notify users when a value is outside of a realistic range, and customized output reports to help users view their data in context. Going through the process of creating detailed project data and metadata also helps point out errors that may have gone overlooked otherwise.
Finally, data management systems can save time and money by reducing the amount of data lost and providing data in a more usable format. One such benefit is sorting data digitally as opposed to analog (Hunt et al. 2015). Data management reduces questions about the data and data collection methods (McEachern and Sutter 2010). This ensures future projects use the most reliable data available (McEachern and Sutter 2010).
Data refers to any piece of information that is necessary for the comprehension, use, and replicability of a study. Common data types include spatial coordinates, numerical values, photos, audio files, supporting documents, metadata, field notes, accuracy assessments (i.e., spatial accuracy of a global positioning system [GPS] location), and negative data (locations visited where nothing was found). A data management plan should be built into every protocol to ensure completeness, quality of data, availability of data for analysis, and an archival system for future use (Fancy and Bennetts 2012; Sutter et al. 2015). The data management plan should include provisions for all data types, and project leaders should be sure to include all data with projects.
The data management system should also integrate metadata and detailed protocol information. Data values cannot be interpreted fully without detailed information about how and why the values were collected. A 2010 study on all rare plant sampling efforts in San Diego County showed that most sampling efforts were not acceptable to use for trend monitoring because of a lack of metadata on the sampling locations, field methods, and an overall lack of proper data handling (McEachern and Sutter 2010).
The SDMMP, in collaboration with USGS, has created a comprehensive data management system that incorporates each of the MSP databases into a single source, the MSP Portal. Creating a single source for the region’s data collection efforts increases accuracy and ease of access for the implementation and development of data. In addition, the information contained in the MSP Roadmap, Vol. 2 (i.e. preserve, threats, vegetation, species) is now available electronically and can be searched spatially or by topic, and the progress of MSP Roadmap implementation can be tracked.
The implementation of the MSP Roadmap requires management of project metadata, field collected data, and MSP Roadmap plan information (goals, objectives, and actions). The MSP Roadmap goals, objectives, and actions are stored in a database so that users can search interactively and easily for the most recent information. The MSP Roadmap is considered a live document and database. Users are encouraged to check the MSP Portal regularly for updates to management and monitoring objectives as well as project metadata and data files. Paper copies of the MSP Roadmap will only be updated at periodic intervals (generally every 5 years), with electronic changes to Vol. 2 information occurring much more frequently (potentially every year or more frequently as needed).
The SDMMP maintains a set of useful databases for the region’s stakeholders. These databases include the Conserved Lands Database, MSP-MOM, SP-Tracker, and South Coast Multi-taxa Database (SC-MTX). Each database is described below, followed by an explanation of how these databases are managed together and available for stakeholder use on the MSP Portal (Figure V1.4-1).
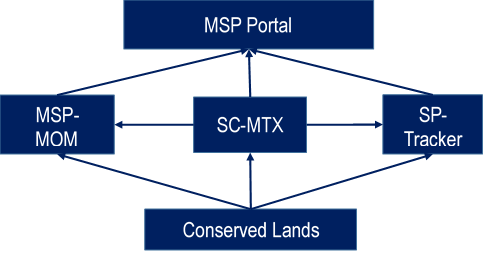
Figure V1.4-1: SDMMP Databases and their relationships to the MSP Portal.
Purpose: SANDAG developed The Conserved Lands Database (CLD) to provide a comprehensive inventory of Conserved Land in the San Diego region. The CLD defines conserved land as "conserved for the purpose of protecting open space and natural habitats including lands inside and outside of NCCP areas, to assist in identifying gaps in conservation, provide general information on the status of land management, and to assist in identifying which preserves have land management plans."
Contents: The CLD includes lands that are conserved to (1) protect natural habitats, species, and open space (including agricultural lands that are important components of the regional habitat preserve design); (2) contribute to the existing and planned regional habitat preserve system; and (3) protect the open space or natural resources into the future. Conservation occurs through public or private acquisitions, conservation easements, land dedications, mitigation, mitigation banks, covenants, or other mechanisms that ensure the land will be not be developed. To be included in the CLD, lands must meet 2 of the 3 criteria identified above.
Fields included in the CLD include, but are not limited to, property name, land owner, land manager, conservation type, conservation date, and management plan date.
Sources of Information: The CLD is a compilation of information from multiple sources including, but not limited to, HabiTrak; SANGIS land use; jurisdiction zoning GIS shapefiles; individual preserve owner/manager GIS shapefiles (including wildlife agencies, County of San Diego, City of San Diego, City of Carlsbad, City of Poway, CDPR, CNLM, and TNC); and various preserve reports.
Format and Availability: The CLD is a geodatabase-GIS shapefile housed on the SANDAG server. It is updated quarterly by the SDMMP. The latest version of the CLD can be accessed via the SanGIS/SANDAG Regional GIS Data Warehouse, under the "Ecology" GIS data category. The latest CLD is also available to view on the MSP Portal, under the ArcGIS Advanced Map Viewer or the MSP Portal spatial search.
Purpose: The purpose of the MSP-MOM is to track the status and management of known occurrences of MSP species. The MSP-MOM was used in the MSP Roadmap to designate management categories, identify occurrences important for management, develop management goals and objectives, and prioritize implementation of management actions. The MSP-MOM will continue to be used to track each species’ status and distribution in the MSPA over time.
Contents: The MSP-MOM includes only records of MSP species in which occurrences are known to be extant (verified data collected since 2000) or likely to be extant after the year 2000. Older data not confirmed were used to inform the development of the MSP Roadmap but are not included in the MSP-MOM. Each occurrence record includes information on land owner, land manager, conservation status, and spatial coordinates.
A record is maintained for every year for which there is information regarding the status of an occurrence (e.g., present versus not detected, number of individuals, areal extent) and includes any information on survey methods, life stage, whether the occurrence is a translocation, known threats, management actions undertaken, recommended management, and data sources.
Sources of Information: Species information included in the MSP-MOM was obtained from existing species accounts, species profile webpages, published scientific papers, management plans, biological reports, baseline survey reports, monitoring databases, conceptual models, and USFWS 5-year reviews, critical habitat designations, listing decisions and recovery plans, plan documents, and databases maintained by the County of San Diego (SANGIS/SANBIOS), City of San Diego (rare plant monitoring, vernal pool inventory), CNDDB, CCH, SDNHM, USGS, CDFW, USFWS and land managers (e.g., CNLM). Preserve names and boundaries are derived from the CLD.
Format and Availability: The MSP-MOM is maintained in a Microsoft Excel spreadsheet. It is available for downloading on the SDMMP website as part of the Environmental Datasets Viewer, found in the ArcGIS Map viewer section.
Purpose: The purpose of the SP-Tracker is to track the status and completion of goals, objectives, and actions in the MSP Roadmap.
Contents: The SP-Tracker is still being developed by the SDMMP in conjunction with the USGS. It contains goals, objectives, and actions from the MSP Roadmap. It also includes information about the status of each objective by linking to specific projects that are addressing each objective.
Sources of Information: The primary sources of information for the SP-Tracker are the MSP Roadmap, Vol. 2, and information submitted by project leads through the MSP Portal Metadata Module.
Format and Availability: The SP-Tracker is maintained in an SQL database and is available to search on the MSP Portal. It can be searched in multiple ways: spatial, topic, and objective status. On the MSP Portal, use the spatial search to view MSP Roadmap information by location (search by preserve, MU, or species occurrence). To search by species, vegetation community, threat, preserve name, or project, use the topic search. To search by objective status, use the track progress function. The status search will show objectives that are completed, in progress, available for implementation, or waiting for a precedent action.
Purpose: The SC-MTX is a publicly accessible, multiple-species database that houses both land management and biological monitoring data collected in the South Coast Ecoregion of southern California (includes all or portions of Santa Barbara, Ventura, Los Angeles, San Bernardino, Riverside, and San Diego Counties). The purpose of the SC-MTX is to centralize and standardize monitoring and management data collected by multiple entities, including federal, state, and local agencies, and make the data accessible to stakeholders.
Contents: The SC-MTX is built on USGS’s existing multi-taxa database (MTX), an SQL data management system that standardizes and archives cross-agency ecological data, from satellite telemetry to stream surveys to tissue samples. The SDMMP collaborated with USGS to expand the MTX to include fields for land management projects (e.g., habitat enhancement, invasive removal, facility improvement, etc.). Projects contained within the SC-MTX can be viewed via the MSP Portal available through the SDMMP website. It is important to note that this database requires standardized data collection methods to allow researchers to compare data across studies.
The SC-MTX is different from other available data management systems in several important ways:
Sources of Information: Monitoring data contained within SC-MTX are contributed by principal investigators of projects. Land management data contained within SC-MTX are typically derived from reports and datasets submitted by land owners/managers.
Format and Availability: The SC-MTX is an SQL database maintained by USGS. The draft data dictionary and database structure are available on the SDMMP website.(http://portal.sdmmp.com/view_article.php?cid=CID_eperkins@usgs.gov_58598e3e4156f). Data contained within SC-MTX can be viewed using the projects list in the SDMMP website.
Applegate, Roger. 2015. The Importance of Data Management in Wildlife Conservation. Wildlife Society Bulletin. 39(3):449-450. DOI: 10.1002/wsb.570.
Fancy, Steven G. and Robert E. Bennetts. 2012. Institutionalizing an effective long-term monitoring program in the U.S. National Park Service. Pages 481-497 in Gitzen et al. Design and Anlaysis of Long-term Ecological Monitoring Studies. Cambridge University Press.
Hunt, Victoria, Sarah K. Jacobi, Melinda G. Knutson, Eric V. Lonsdorf, Shawn Papon, and Jennider Zorn. 2015. A Data Management System for Long-Term Natural Resource Monitoring and Management Projects with Multiple Cooperators. Wildlife Society Bulletin. 39(3):464-471. DOI: 10.1002/wsb.547. (http://onlinelibrary.wiley.com/doi/10.1002/wsb.547/pdf)
Mason, Russ, Len H. Carpenter, Michael Cox, James C. Devos, John Fairchild, David J. Freddy, Jim R. Heffelfinger, Richard H. Kahn, Scott M. McCorquodale, David F. Pac, Danny Summers, Gary C. White, and B. Kenneth Williams. 2006. Wildlife Society Bulletin. 34(4):1238-1242.
McEachern, Kathryn and Rob Sutter. 2010a. Assessment of Eleven Years of Rare Plant Monitoring Data from the San Diego Multiple Species Conservation Plan. USGS-WERC Channel Islands Field Station Administrative Report 2010-01, Ventura, CA, 146 p.
Moore, Clinton, Terry Shaffer, and Jill Gannon. 2013. Spatial Education: Improving Conservation Delivery through Space-Structured Decisions Making. Journal of Fish and Wildlife Management. 4(1):199-210. doi: 10.3996/082012-JFWM-069
Sutter, Robert, Susan B. Wainscott, John R. Boetsch, Craig J. Palmer, and David J, Rugg. 2015. Practical Guidence for Integrating Data Management into Long-Term Ecological Monitoring Projects. Wildlife Society Bulletin. 39(3):451-463. DOI: 10.1002/wsb/548.
Williams, Byron and Eleanor Brown. 2012. Adaptive Mangement: The U.S. Department of the Interior Applications Guide. U.S. Department of Interior, Washington, D.C., USA. https://www2.usgs.gov/sdc/doc/DOI-Adaptive-Management-Applications-Guide-27.pdf. Accessed October 28, 2016.
Implementation of the MSP Roadmap will require the combined resources of multiple key organizations. These organizations include SANDAG; SDMMP; Stakeholders; Funding Providers; Implementation Entities/Organizations; and various contractors, scientists, and land manager groups. These organizations and roles and responsibilities are described below. A graphic showing the flow of information for the MSP Roadmap implementation process is provided in Figure V1.5 1.
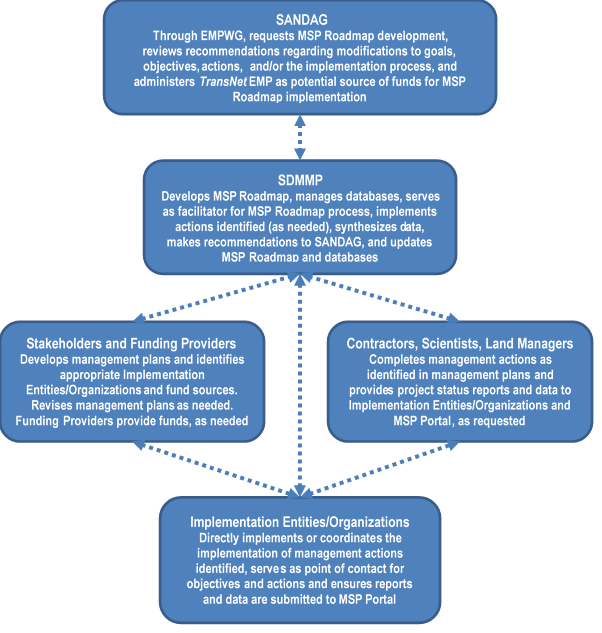
Figure V1.5-1. MSP Roadmap implementation process flow of information.
SANDAG is composed of the local governments of 18 cities within San Diego County and the County of San Diego. It administers the TransNet EMP. SANDAG, through its Environmental Mitigation Program Working Group (EMPWG), requested the development of the MSP Roadmap and will be responsible for periodically assigning a group to review recommendations on modifications to goals, objectives, actions, and/or the implementation process and providing funds from the TransNet EMP for MSP Roadmap implementation, if appropriate, and as needed.
The SDMMP is a science-based program seeking to provide a coordinated approach to management and biological monitoring of lands in San Diego that have been conserved through various conservation programs including the MSCP, MHCP, proposed NCP, TransNet EMP, and various other conservation and mitigation efforts. The SDMMP is responsible for developing the MSP Roadmap, developing and managing databases (see Vol. 1, Sec. 4.0) for tracking the completion of MSP Roadmap goals, objectives, and actions and maintaining monitoring and management datasets, facilitating the MSP Roadmap process, completing management and monitoring actions as identified (if identified as an appropriate Implementation Entity/Organization; see below), synthesizing monitoring and management datasets, making recommendations to SANDAG and other regional entities on modifications to MSP Roadmap goals, objectives, actions, and/or the implementation process, and updating the MSP Roadmap.
Stakeholders are defined as those groups who have an investment or interest in conservation management in the San Diego region and include, but are not limited to, landowners, land managers, funding entities, scientists, the wildlife agencies, development interests, regional management and monitoring programs, nonprofit institutions, environmental consultants, County of San Diego, and the 18 cities within San Diego County. The Stakeholders will be responsible for developing management plans, identifying appropriate Implementation Entities/Organizations to take the lead for implementing objectives, identifying appropriate groups (i.e., contractors, scientists, and land managers) to implement actions if not the identified Implementation Entities/Organizations, and identifying the appropriate funding sources and entities that will hold and disburse the funds, if needed. The Stakeholders will need to select the appropriate groups to implement the management and monitoring actions based on willingness, capability, capacity, and funding source.
Several existing potential Funding Providers may be involved in funding the implementation of MSP Roadmap objectives. A list of funding sources that have been used for management and monitoring projects in San Diego County is provided in Table V1.5-1. The Funding Providers will coordinate with Stakeholders to develop management plans, coordinate with the Implementation Entities/Organizations in the implementation of objectives and actions, and provide funding using the appropriate mechanism (i.e., grant, agreement, contract, internal accounts, etc.) to implement identified actions.
Table V1.5-1. Potential funding providers for MSP Roadmap implementation.
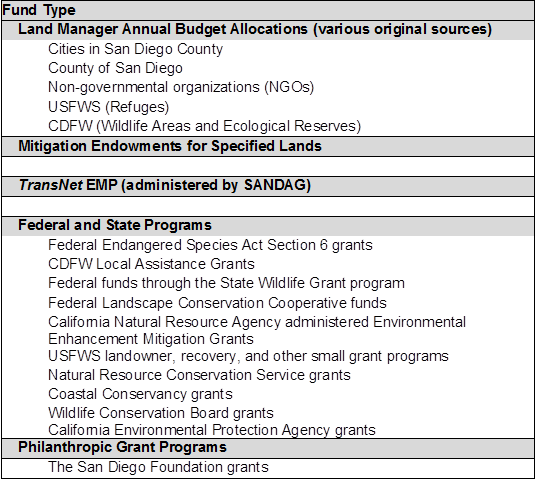
An Implementation Entity/Organization is an organization that takes the lead for implementing regional and/or local objectives identified in the MSP Roadmap and management plans. The Implementation Entity/Organization will be responsible for directly implementing or collaborating with others in the implementation of the specified actions according to the MSP Roadmap timeline. The Implementation Entity/Organization will also be the point of contact for the objectives, actions, and relevant management plans and for ensuring project status reports and data are submitted to the MSP Portal (see Vol. 1, Sec. 4.0). Project status reports should include specifics on what actions were completed along with dates of completion and level of effort required, and should follow the typical scientific paper format (e.g., introduction, methods, results, and discussion).
A variety of contractors, scientists, and land manager groups may be involved in implementing the management and monitoring actions identified in the MSP Roadmap. The identified group(s) will be responsible for directly implementing the management and monitoring actions identified, coordinating with the Implementation Entity/Organization, providing project status reports and data to the Implementation Entity/Organization, and entering data directly into the MSP Portal, if requested.
The MSP Roadmap is a comprehensive, adaptive management and monitoring framework for western San Diego County that provides a regional strategy for 111 species, 11 vegetation communities, and 13 threats/stressors, including loss of connectivity, altered fire regime, invasive animals and plants, and many other elements. The MSP Roadmap includes an adaptive management feedback loop that integrates monitoring and management actions into an iterative approach to achieve conservation goals. MSP Roadmap objectives incorporate what has been learned from previous monitoring and management to improve efficiency and effectiveness.
While Vol. 1 provides the operational information on overview and approach, the functional part of the MSP Roadmap is Vol. 2, which includes databases and mapping tools on the MSP Portal. The MSP Roadmap is intended to be a living document with revisions to the databases and maps occurring as new information becomes available (e.g., new occurrences discovered) or as on-the-ground conditions change (e.g., wildfire, flood, etc.). It is anticipated that actions, which are considered suggested strategies to complete objectives, will change (i.e., added to or removed) most frequently as needed to match current opportunities and/or methods. Measurable objectives are expected to change less frequently and would be based on an analysis of progress toward meeting the goals. The MSP Portal should be used to access the most up-to-date information on goals, objectives, and actions and to query, map, and track the progress of MSP Roadmap implementation.
Due to limited resources, not all species, vegetation communities, or threats/stressors have been given priority in the next 5-year calendar planning cycle (2017–2021; see Vol. 1, Sec. 2.0, for rationale). The MSP Roadmap categorizes and prioritizes resources and provides a timeline for implementation. The goals, objectives, and actions included in the MSP Roadmap cross jurisdictional and NCCP plan boundaries and are intended to benefit the region’s natural resources by bringing partners together to implement a shared vision. Implementation of the MSP Roadmap is only possible through the combining of resources from multiple key organizations. Regional coordination and collaboration have greatly increased since the EMP inception. The next step is creating formal agreements (e.g., Memorandum of Agreement/Understanding) between these key organizations for increased resource sharing and implementing joint management and monitoring actions across ownership boundaries.
Volume 2 is split into 4 sub-volumes (A-D). Volume 2 contains functional information including goals, objectives, and actions, for the preserve system, threats, vegetation communities, and species. Information for Volume 2 will be updated regularly and the most recent information will be available through the MSP Portal. Volume 2 will refer to the acronym list in Volume 1.
Goals, objectives, and actions are viewed through the SP-Tracker on the MSP Portal. SP-Tracker is a system to organize and view MSP plan information. Each sub-volume contains explicit steps to find the relevant information on the website. Use the guide below to understand each component of the SP-Tracker output.
Objectives listed are presented with the objective number, objective code, objective scale, years prioritized, management units, and objective text. There are 3 additional tabs that expand to provide more information. Actions provides a list of actions, the current status of the action, and a link to any projects that are currently working on the action. Goal provides the goal text that is associated with the objective. And Success Criteria provides the success criteria text and the year it is scheduled to be accomplished. Use the diagram below for more information.
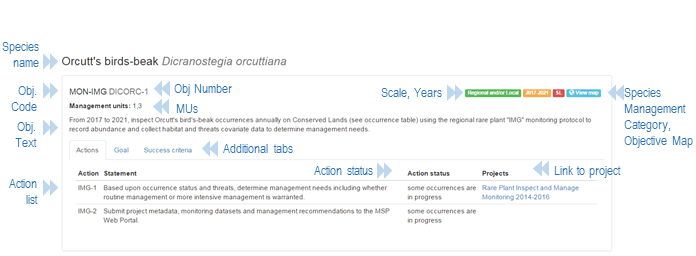
SP-Tracker filters also allow users to create complicated searches. Multiple filters can be selected to show a unique list of objectives and actions. Search options include:
For example, a land manager may want to find all the currently prioritized objectives that are available for implementation on their preserve. To find this information, set Action Status to "available for implementation", Year to "2017", and Preserve to the desired preserve name and owner. Click Submit and a unique list will result with all matching objectives.
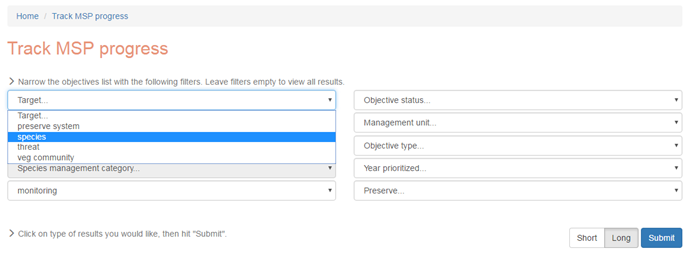
The Natural Community Conservation Planning (NCCP) program plans were developed with the goal of ensuring the long-term persistence of viable populations of covered plant and animal species and their natural habitats and of maintaining ecosystem functions (City of San Diego 1998; SANDAG 2003). Biological monitoring was intended to track population trends of covered species and detect changes in habitat quality to determine conditions requiring active management, and to assess how well the conservation strategy was working to maintain natural ecological functions (Ogden 1996; SANDAG 2003).
The San Diego NCCPs have been monitoring and managing biological resources since at least the mid-1990s. However, few long-term monitoring studies have been implemented that can answer the question of how well the entire preserve system is working and whether conservation and management goals are being met. How is the preserve system changing through time in response to threats, such as climate change and wildfires? Now that much of the preserve system is assembled, the next step is to implement a long-term regional preserve system monitoring program to track environmental changes through time, such as changes in abiotic conditions and threats, and relate these to changes in the status of species, vegetation communities, and ecosystem functions to make better informed management decisions.
There are 4 target monitoring groups in the Management and Monitoring Strategic Plan for Conserved Lands in Western San Diego County: A Strategic Habitat Conservation Roadmap (or simply "MSP Roadmap" or "MSP"): abiotic, threats, vegetation, and MSP species (see Vol. 1, Sec. 2.4.2). Abiotic monitoring tracks abiotic conditions (e.g., climate, soils, and hydrology) over time and evaluates factors associated with changing conditions. Threats monitoring focuses on determining the types and levels of threats and understanding why they change over time, testing best management practices (BMPs), and evaluating the success of management to reduce threat levels (Vol. 2B). Vegetation monitoring tracks the distribution, composition, structure, and integrity of vegetation communities over time and identifies threats and abiotic factors associated with changes in community attributes (Vol. 2C). Vegetation monitoring also informs development of BMPs and assesses whether management is effective at reducing threats and improving vegetation characteristics. MSP species monitoring concentrates on documenting changes in species distribution and status and how such changes are related to threats, vegetation, and abiotic factors (Vol. 2D). Species monitoring also includes conducting targeted research studies to address critical uncertainties, developing BMPs, and evaluating management effectiveness at reducing threats and enhancing populations.
The regional preserve system monitoring integrates and synthesizes data from these 4 target monitoring groups and from other sources with the goal of evaluating and communicating how well the preserve system is functioning to meet NCCP conservation goals and MSP Roadmap management goals. This assessment is intended to (1) characterize the level of success at meeting conservation goals; (2) describe what has been done to protect, maintain, and improve the preserve system; (3) explain what has been learned from monitoring and managing conserved resources; and (4) to provide indicators of ecosystem health or condition.
The MSP Roadmap focuses on managing for the ecological integrity of vegetation communities and ecosystems (Vol. 1 Sec. 2.4.1 and Sec. 2.4.2), an important component of the regional preserve system goal. Ecological integrity measures the ability of an ecological system to support and maintain species composition, diversity, and functions that are within the range of historical variation or comparable to that of natural pristine habitats in the region (Parrish et al. 2003). A system with high ecological integrity is more resilient to threats and natural disturbance processes and has the ability to return to its original state following disturbance (Parrish et al. 2003; Wurtzebach and Schultz 2016). Evaluating resilience in relation to the historical or current range of variability can allow inference about rates of recovery and the potential for regime shifts (Seidl et al. 2016). Managing to increase resilience is especially important under changing disturbance regimes where there is increased uncertainty and stochasticity of disturbance processes.
Characterizing the condition and health of the preserve system under an increasing array of threats and natural disturbances leads to the primary question: What is the ecological integrity of the MSPA preserve system, is it changing over time and why?
Monitoring the ecological integrity of the preserve system requires identifying key attributes to survey that characterize environmental conditions; the type and magnitude of threats and their interactions; and the responses of species, vegetation communities, and ecosystem processes.
Regional preserve system monitoring involves a 2-pronged approach. When addressing ecological integrity, it is important to evaluate processes at multiple scales, including the landscape scale at which larger processes operate (Seidl et al. 2016). The first step is to conduct an office-based assessment of the preserve system using geographic information system (GIS) data layers to develop landscape-scale metrics that characterize environmental conditions across the MSP Roadmap Area (MSPA). This is considered CORE monitoring and can be conducted annually or less frequently if there are no updates to the underlying spatial data. The process involves compiling all GIS-based data layers and predictive models and determining which variables are relevant to characterizing the integrity of the preserve system. Some potential data sources include current and future climate conditions, soil attributes, fire history, nitrogen deposition rates based on predictive models, fragmentation and road impact calculations, artificial night lighting levels, invasive plant distributions, and vegetation community classification based on regional (vegetation class) and preserve level (alliance, association) vegetation mapping.
The second approach is to collect field-based monitoring data that characterize the condition of the preserve system at specific sites and provide detail on threats; environmental conditions; and the status of MSP species, vegetation communities, and ecosystem processes. There is overlap between the different levels of monitoring that can be used to improve efficiencies where feasible. Vegetation monitoring can be designed as part of a larger ecosystem integrity monitoring effort, such that permanent vegetation sampling plots are co-located with monitoring plots where taxonomic groups, ecosystem processes and threats are monitored to assess ecosystem integrity. Specific monitoring questions will be developed for characterizing ecological integrity to determine which covariate and response variables to measure, to prioritize the various variables for monitoring, and to determine the frequency and schedule of monitoring. The long-term permanent vegetation monitoring plots, considered CORE+ monitoring, will be established across the MSPA to encompass the range of variation in east-to-west and north-to-south environmental gradients.
The addition of other components to track the ecological integrity of the system is considered CORE++ monitoring. The additional monitoring components could include monitoring MSPA species, surveying the biodiversity of various taxa, monitoring indicator species selected to represent the response of a suite of species to ecosystem processes, measuring important ecosystem processes, and determining the type and level of anthropogenic threats. These additional components may be monitored using rapid assessments and optimized protocols. Data from these add-on monitoring components can be used to calibrate whether vegetation data are sufficient to characterize ecological integrity for the broader preserve system. Some variables might be measured just once (e.g., soil texture, soil type, topography), others on a regular basis (e.g., vegetation), or continuously (e.g., weather station climate variables).
An important step in designing a regional preserve system monitoring program is to work with land managers, wildlife agencies, and scientists to review existing GIS-based data sources and monitoring program datasets to select appropriate metrics for evaluating and communicating the status of the preserve system. These monitoring metrics should be based on indicators that are useful for conveying information about the ecological integrity (i.e., composition, structure, and function) of the system over time and across spatial scales (Wurtzebach and Schultz 2016). In selecting monitoring indicators, it is important to use conceptual models or summaries of existing knowledge about key ecological interactions (Parrish et al. 2003; Wurtzebach and Schultz 2016), such as relationships between threats and MSP species, vegetation communities, and ecosystems processes. Using this information, it is possible to select key attributes of the system as monitoring metrics that characterize the regional preserve system and can be tracked over time and across multiple spatial scales (Wurtzebach and Schultz 2016). An Index of Biological Integrity (IBI) can also provide an overall assessment of the ecological integrity of an ecosystem, but can be problematic due to the complexity of terrestrial ecosystems (Wurtzebach and Schultz 2016). An IBI has been developed for coastal sage scrub that performs well in distinguishing integrity classes across a disturbance gradient (Diffendorfer et al. 2003).
A number of different metrics can be used to characterize and communicate how well the preserve system is working. Various monitoring data will be selected, compiled, analyzed, and synthesized to provide simple to complex metrics evaluating the overall state of the preserve as well as success in meeting specific MSP species, vegetation, and threat management goals. The types of metrics selected to characterize the status of the preserve system depend in part on the target audience. Simple metrics can be compiled that are most relevant to the public and decision makers and that provide easily understood descriptors of how the preserve system is doing overall. More complex metrics may be applicable to land managers, scientists, and others involved with making management decisions. These metrics often require greater knowledge of the system to interpret and typically involve analyses of biologically complex datasets to determine whether management objectives are being met, to fully characterize the status and ecology of the monitoring target, and to understand threat and habitat relationships.
Ecological integrity metrics can be used to assess whether is it likely that conservation and management goals will be achieved for long-term persistence of viable populations of MSP species in their natural habitats or the maintenance of ecosystem functions. For example, if measures of ecological integrity for a particular vegetation community are found to be rapidly declining across the MSPA, this could be a warning that it may not be possible to meet the conservation goal of long-term persistence for the vegetation community and potentially for the MSP species dependent on it. However, with directed and appropriate management, ecological integrity metrics can also demonstrate the response of the vegetation community to management and, if successful, an improved likelihood of meeting conservation goals. Ecological integrity metrics provide a simple way to conceptualize more complex ecological processes and explain what has been learned from managing different components of the preserve system. Ecological integrity metrics also provide a way to characterize the overall health or condition of an ecosystem and of the individual components. Summarizing different metrics can provide an indication of the overall status of the preserve system.
Examples of some simple metrics for communicating with the public and decision makers include reserve assembly metrics, such as the total amount of land and number of vegetation communities conserved and lost to development since the NCCPs were established, with perhaps a comparison of these metrics to the pre-NCCP period. Other simple metrics are more ecologically based and characterize the health of the preserve system. An example includes using remote imagery to map ecological integrity classes over time to determine the number of acres of shrubland that have converted to nonnative grassland across the MSPA. MSP species datasets could be used to assess the status of groups of species, such as coastal sage scrub dependent species, rare plants, highly threatened and vulnerable species, or wide-ranging species. Threat metrics could characterize the magnitude of different threats across the MSPA, including fire risk (e.g., departure from historic median fire return intervals, probability of ignition, number of times burned since 2000), invasive species, constrained linkages, and climate change projections with modeled species responses. Management metrics could describe the investment in and effectiveness of management actions to illustrate efforts taken to protect and improve the preserve system.
Meta-analyses and syntheses of landscape-scale and field-based metrics will be used to characterize different aspects of the preserve system to identify common effects or landscape-scale patterns. These analyses evaluate how well the preserve system is functioning and if conservation and management goals are being achieved. Communicating metrics clearly is important and relies on a format that is accessible and can effectively communicate information to managers and the public. The best metrics for communicating with a more general audience are conceptually simple key indicators that describe the status of the preserve system and important MSP species, vegetation communities, and ecological processes. Score cards are an effective way of communicating with assessment categories based on historic range of variation or comparisons with pristine natural systems (Wurtzebach and Schultz 2016). These thresholds can also be used in management decision making by land managers and to trigger further evaluation of the system, vegetation, or species.
The office-based evaluation of the preserve system incorporates landscape-scale GIS data layers for the MSPA to characterize current environmental conditions, different types and levels of threats, MSP species distributions, and vegetation community types. Statistical analyses and modeling will be used to create GIS layers that predict current and future conditions across the landscape, such as species habitat suitability models for different scenarios of climate change, climate variability and refugia modeling, cumulative threat vulnerability rankings, fire risk analyses, connectivity constraints, and biodiversity hotspots. Landscape-scale assessments can be done on a periodic basis and are considered CORE level monitoring.
Potential GIS data sources for characterizing the regional preserve system include land use maps, climate layers, Digital Elevation Models to describe topography, soil maps, vegetation maps, fire perimeters, burn severity maps, erosion potential maps, satellite imagery, high resolution aerial photos, and LIDAR (Light Detection and Ranging). GIS databases include Conserved Lands, MSP-MOM, SC-MTX, rare plant monitoring spatial data, SANBIOS, CNDDB, and various species monitoring spatial datasets. Table V2A.1-1 provides examples of types of variables that can be calculated and included as metrics to characterize the preserve system or that can be incorporated into more complex analyses to develop synthetic metrics. For example, vegetation maps can be used to calculate the number of different vegetation types in the preserve system and can also be used to calculate variables used in habitat suitability models or connectivity modeling.
GIS data layers can be used to develop spatially explicit models and conduct complex analyses. These include species habitat suitability models under current and future climate, land use, and fire scenarios; climate change projections; climate variability and refugia analyses; watershed urbanization and water flow models; nitrogen deposition models; carbon sequestration models; connectivity models; and fire risk models.
Table V2A.1-1: Examples of simple landscape-scale metrics that can be calculated with GIS to characterize the regional preserve system.
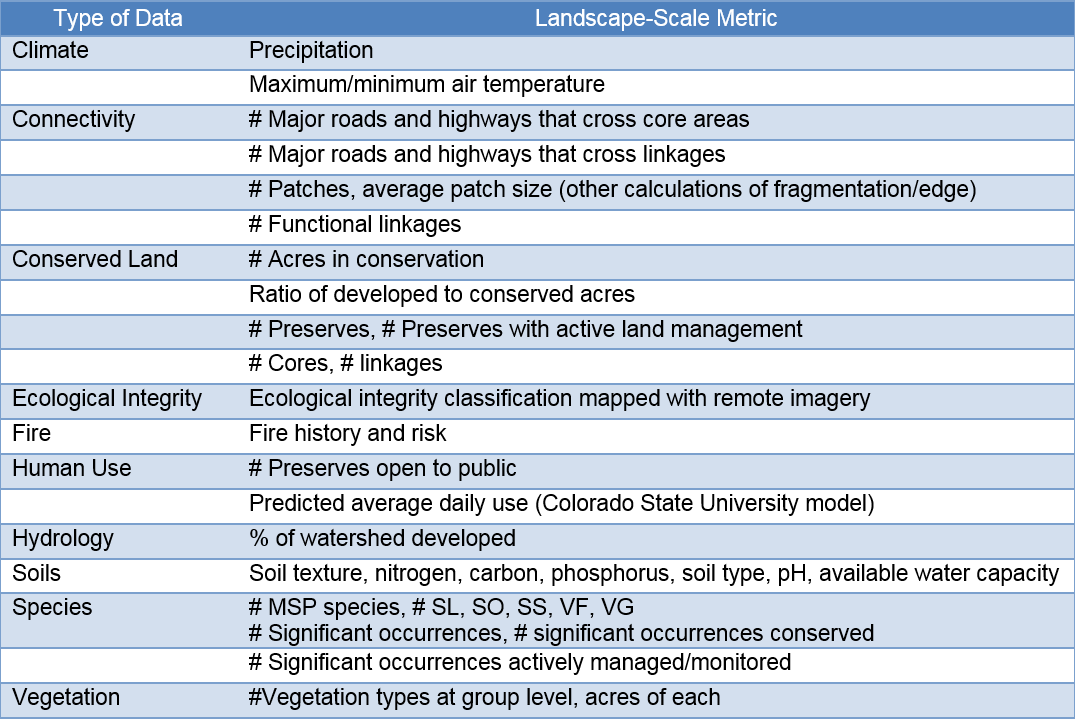
An example of how multiple data layers can be incorporated into a synthetic analysis is a cumulative stressors analysis (Table V2A.1-2) conducted by the San Diego Management and Monitoring Program (SDMMP) that assesses the accumulation of threats to identify areas in the MSPA that are particularly affected by known stressors. In this example, the accumulation of stressors was calculated as an index that measures the relative level of each threat across the MSPA. The threats considered included road density, urban edges/Argentine ants, fire frequency, feral pigs, and invasive plants (see Vol. 2B for more info on threats). For each threat, a raster layer was created where each cell (10 feet by 10 feet) contained a point value (0–4) relating to the level of threat present. More intense stressors were given higher point values. The sum of all the threat point values created a relative scale of cumulative threat level. The raster layers for each threat were summed to produce an overall score of cumulative threats. The higher value numbers indicate a higher threat to habitat. The maximum possible index value was 20.
Table V2A.1-2: Point values used to calculate the cumulative threat index.
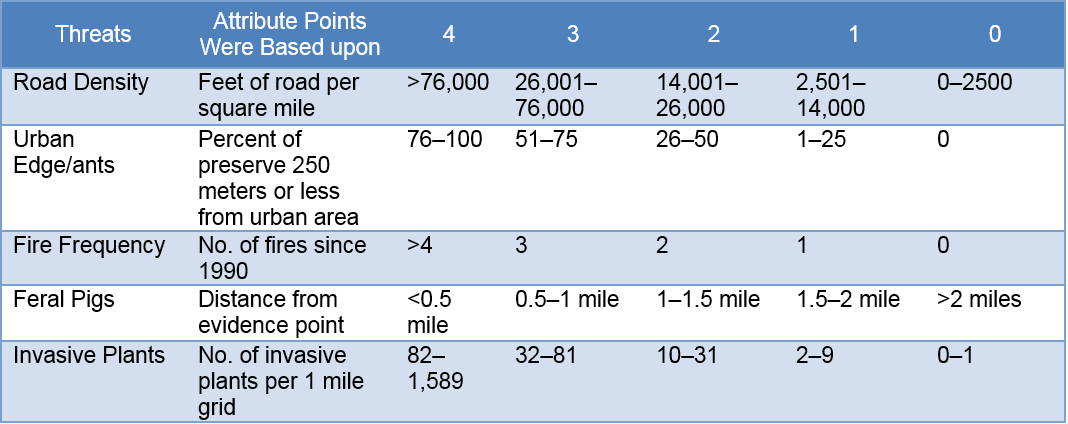
A network of remote automated weather stations and soil sensors will be established to continuously monitor abiotic conditions across the regional preserve system, particularly climate-related variables that are important to the distribution and status of MSP species and vegetation communities and ecological processes. It is important to characterize climate at a relatively fine scale across the landscape in order to assess how climate and soil variables affect monitoring targets. The network of automated weather stations will be established at preserves and will also include, as feasible, existing weather station networks (e.g., National Oceanic and Atmospheric Administration, San Diego Gas and Electric Company). Soil data loggers can be placed at long-term permanent vegetation monitoring sites. The types of abiotic variables that can be measured at weather stations include ambient temperature (average, minimum, and maximum), precipitation, relative humidity, fog, and wind speed and direction. Soil data loggers can measure soil moisture and temperature. These variables can be monitored throughout the annual cycle and at different scales using continuous data loggers. Data from these stations will be used as covariates in analyses of species distribution and status, and vegetation community composition and structure, and to assess ecological processes.
Most of the monitoring conducted in the MSPA is site-based field monitoring as part of MSP species, vegetation communities, and threat management and monitoring objectives. Other monitoring components can be added in as feasible to address questions that are important to regional preserve system integrity monitoring.
CORE+ monitoring includes long-term vegetation monitoring that typically consists of establishing permanent plots and a rotating panel of plots to expand the spatial sampling area (see Vol. 2C). Types of monitoring variables include community composition and structure, integrity, and abiotic and threat assessments. Vegetation communities with objectives for this type of monitoring in 2017–2021 include coastal sage scrub, chaparral, grassland, oak woodland, and riparian forest and scrub. Plant monitoring metrics may include species richness, percent cover, plant height, density, population size, seedling recruitment, and mortality. The types of abiotic variables measured can include climate data from automated weather stations and soil sensors, soil attributes from site-specific sampling, and topography variables generated from GIS. Threats are assessed at the site including fire, altered hydrology, disease, herbicides, human use, invasive plants, invasive animals, pests, loss of ecological integrity, and urban development. Threats can also be characterized based on GIS layers such as altered fire regime, climate change, loss of connectivity, and urban development. For chaparral, coastal sage scrub, and grassland vegetation monitoring, ecological integrity metrics include describing the level of disturbance from nonnative plants and are interpreted in relation to fire and drought (see Vol. 2C).
CORE ++ includes monitoring components to evaluate the ecological integrity of the regional preserve system and typically builds upon vegetation monitoring at permanent plots. As feasible, it can include monitoring of the status and habitat and threats of MSP species (SL, SO, SS and VF species). Additional monitoring components can include community level monitoring of arthropods, amphibians, reptiles, birds, and small mammals (Table V2A.1-3). The U.S. Geological Survey (USGS) is developing rapid assessment protocols to monitor threats and various taxonomic groups and preparing community level monitoring optimized protocols for greater efficiency. Other types of monitoring include assessing food webs (e.g., arthropod food resources for MSP bird species), animal movement (digital camera stations), pollinator services, carbon cycling, soil microbes, and biotic interactions (Table V2A.1-4). Threat monitoring can include components identified above for vegetation monitoring. A multi-taxon IBI can also be developed based on rapid assessments and optimized sampling of different taxonomic groups and added to the vegetation monitoring component to sample ecological integrity across the MSPA. Diffendorfer et al. (2007) conducted a study of 5 plant and animal taxomic groups in coastal sage scrub vegetation and found that an IBI could be developed to characterize ecological integrity across a disturbance gradient of invasive nonnative grasses. They found that the IBI performed better than traditional community metrics and that no single taxon was a good indicator of the responses of the other taxa to the disturbance gradient. Responses to disturbance were varied and complex among the different taxonomic groups and there was large variation at multiple scales in abiotic and biogic conditions across the study area. The IBI was able to address this variability and characterize the ecological integrity of sites with 1 measure, which could be decomposed into individual components to understand how the different taxa responded to the disturbance gradient.
Table V2A.1-3: Examples of components for Core++ monitoring
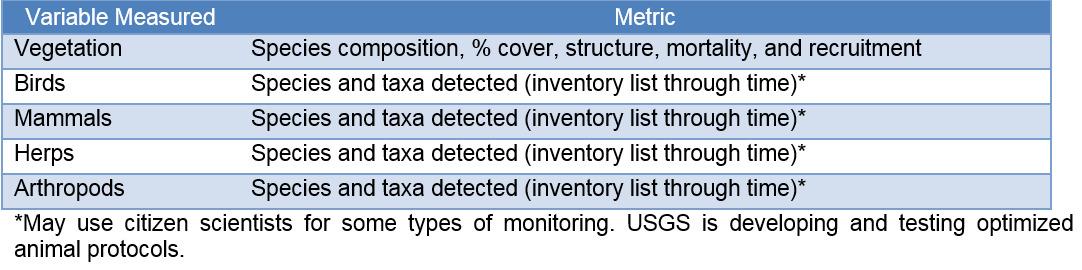
Table V2A.1-4: Examples of metrics that can be measured across the preserve system.
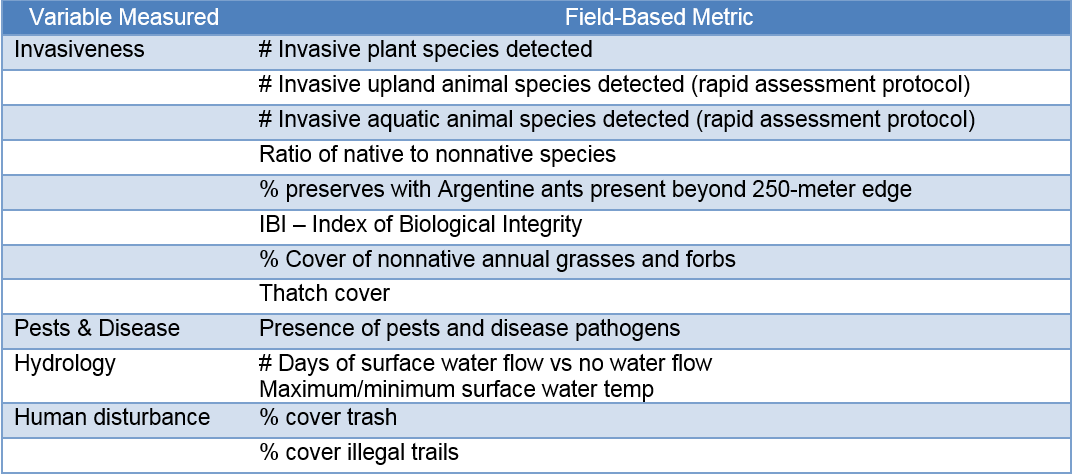
The goal for the regional preserve system is to maintain, enhance, and restore native ecosystems within a network of connected Conserved Lands across the MSPA to support vegetation communities with high ecological integrity, biodiversity, and natural ecological processes and that provide for self-sustaining MSP species populations resilient to environmental stochasticity, and catastrophic disturbances and threats, and that will likely persist over the long term (>100 years). This goal does not represent a substantial new management and monitoring effort; rather, it incorporates management and monitoring goals and strategies for individual MSP species, vegetation communities, and threats into a broader overall regional preserve system goal.
During the 2017–2021 planning cycle, there is an objective to analyze and synthesize existing GIS-based datasets characterizing conditions across the MSPA, including the distribution and magnitude of threats; vegetation communities; ecological integrity of chaparral, coastal sage scrub, and grasslands; abiotic monitoring elements; and MSP species. From these analyses, clear, easily understood monitoring metrics will be developed to communicate with the public and policy makers the status of the preserve system. A State of the Preserve Report will be prepared in 2017 and the metrics will be posted on the MSP Portal. These analyses will be repeated in 2020 and expanded to include more complex monitoring datasets arising from abiotic, threat, vegetation, and MSP species monitoring objectives. A more detailed State of the Preserve Report will be prepared in 2020 with monitoring metrics displayed on the MSP web portal. The general goals, objectives, and actions for the regional preserve system are listed on the MSP Portal under the Regional Preserve System summary page (Preserve System Objectives
City of San Diego. 1998. Final Multiple Species Conservation Program: MSCP Plan.
Diffendorfer, J. E., G. M. Flemming, J. M. Duggan, R. E. Chapman, M. E. Rahn, M. J. Mitrovich, and R. N. Fisher. 2007. Developing Terrestrial, Multi-Taxon Indices of Biological Integrity: An Example from Coastal Sage Scrub. Biological Conservation 140:130–141.
Ogden (Ogden Environmental & Energy Services Co., Inc.). 1996. Biological Monitoring Plan for the Multiple Species Conservation Program. Prepared for City of San Diego Metropolitan Wastewater Department, California Department of Fish and Wildlife, and U.S. Fish and Wildlife Service.
Parrish, J. D., D. P. Braun, and R. S. Unnasch. 2003. Are We Conserving What We Say We Are? Measuring Ecological Integrity within Protected Areas. BioScience 53:851–860.
SANDAG (San Diego Association of Governments). 2003. Volume I: Final MHCP Plan. Prepared for Multiple Habitat Conservation Program.
Seidl, R., T. S. Apies, D. L. Peterson, S. L. Stephens, and J. A. Hicke. 2016. Searching for Resilience: Addressing the Impacts of Changing Disturbance Regimes on Forest Ecosystem Services. Journal of Applied Ecology 53:120–129.
Wurtzebach, Z. and C. Schultz. 2016. Measuring Ecological Integrity: History, Practical Applications, and Research Opportunities. BioScience 66:446–457.
Volume 2B provides information on MSP threats. Each section includes an overview of the threat, the management and monitoring general approach, general objectives, species-specific objectives, and references.
Threats include:
General overview: This section provides an introduction to the threat, an explanation of how the threat impacts the MSPA, and geographic locations impacted.
Management and monitoring approach: This section is a description of the general methods of the management and monitoring objectives. This provides the overall strategy and goal of the objectives and actions.
General objectives: This section provides objectives and actions that apply to the threat in general. These objectives do not focus on individual MSP species, but identify activities to decrease the threat’s impact to the MSPA as a whole.
Species-specific objectives: This section provides a list of MSP species that are particularly vulnerable to the threat described. It contains a link to each species section which contains objectives specifically designed to decrease the impact of the threat on the MSP species.
Find information on the MSP Portal: Use the guide below to find the information for Volume 2B on the SDMMP Portal (portal.sdmmp.com).
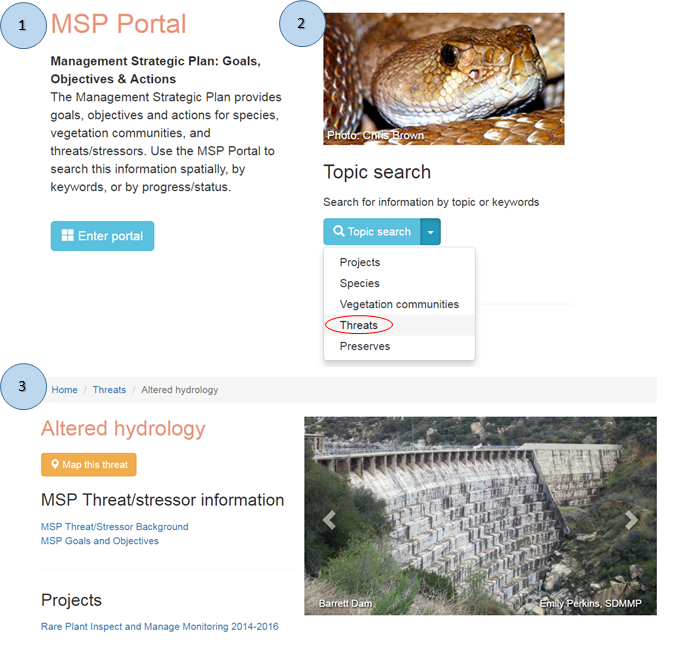
Volume 2C provides information on MSP vegetation communities. Each section includes an overview of the community, the management and monitoring general approach, general objectives, species-specific objectives, and references.
Vegetation communities include:
General overview: This section provides an introduction to the vegetation community, including the community’s geographic locations and acreages, specific alliances and associations within the community, animal species that use the community, and threats to the community.
Management and monitoring approach: This section is a description of the general methods of the management and monitoring objectives. This provides the overall strategy and goal of the objectives and actions.
General objectives: This section provides objectives and actions that apply to the vegetation community in general. These objectives do not focus on individual MSP species, but identify activities to increase the quality and resilience of the entire community.
Species-specific objectives: This section provides a list of MSP species that use and will benefit from management of the vegetation community. It contains a link to each species section which contains objectives specifically designed to benefit the species and the vegetation community.
Find information on the MSP Portal: Use the guide below to find the information for Volume 2C on the SDMMP Portal (portal.sdmmp.com).
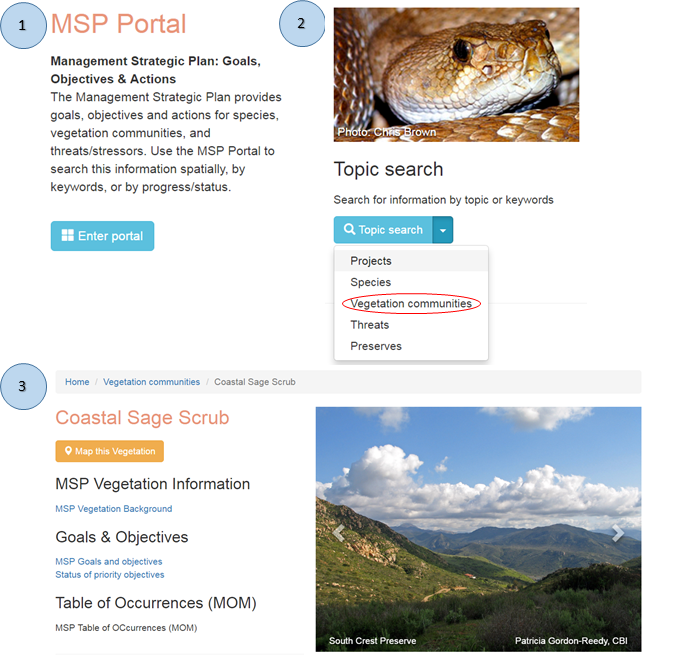
Volume 2D provides the management goals and objectives for each SL, SO, and SS species in the Species Management Focus group. A list of species can be found at: https://sdmmp.com/species.php. Each species subsection consists of seven parts:
Species Name: The current scientific and common name is provided.
Management Units with Known Occurrences: A description of the habitat the species is most often associated with is provided along with locations of known occurrences within the MSPA, each MU, and outside the MSPA, if known.
Management Categorization Rationale: The rationale for assigning the species to a management focus group and category is provided. Also provided are known threats/stressors; these are generally specific to the known occurrences on MSPA Conserved Lands if the information was available.
Management and Monitoring Approach: An overview of the management and monitoring approach is provided, including details on the purpose of the objectives and actions, and background information that would help inform the implementation process.
Table of Species Occurrences identified for management (or potential management): A table listing each species occurrence identified for management or potential management is provided. The table includes the occurrence name, MU, preserve name, land owner, land manager, maximum individuals documented since 2000, year the information pertains to, reported threats to the occurrence, and sources.
Species Distribution Maps: Online maps showing the locations of occurrences within the MSPA are included for each species. MU’s are labeled by number. Conserved Lands are shown in green with no border. Current occurrences are shown in red circles and historic locations, if included, are shown in black circles.
Management Goals and Objectives: A table is provided that includes the regional goal, MU goal(s) (if applicable), and objectives for each species. For each objective, the general management type (i.e., IMG, ISV, SB, etc.), MU, and actions are provided along with whether the objective is to be implemented at the regional or local scale, or both.
Find information on the MSP Portal: Use the guide below to find the information for Volume 2D on the SDMMP Portal (portal.sdmmp.com).
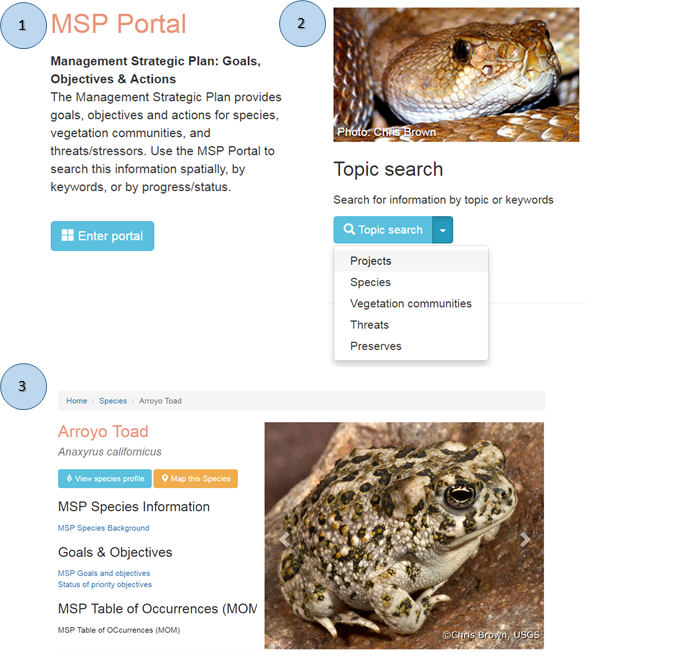
1. 2015 Fire Workshop Materials (to be posted when finalized)
1. 2014 Connectivity Workshop Materials
2. Incorporating Genetic Sampling in Long-Term Monitoring and Adaptive Management in San Diego County. (to be posted when finalized)